Comparison RDI and EMF Map
Validation of measurement results against official RDI measurements
Introduction
The RDI (National Service for Digital Infrastructure) performs measurements to check radiation levels in the Netherlands. Approximately 200 measurements are taken annually at various locations. EMF Map NL has compared the measurement results of the RDI with its own measurements. At six locations, measurements were performed by both the RDI and EMF Map NL. Most of these results are in good agreement.
Despite differences in equipment and methodology, the measurements broadly confirm each other's findings.
Information Measurements RDI
The RDI conducts spot checks and public information measurements. In spot checks, only the average radiation is recorded. This figure is of interest to physicists. Biologists also want to know the maximum peak value, as this is considered responsible for the biological damage that could occur. The maximum peak value is only recorded by the RDI in reports for public information measurements.
Between 2021 and 2024, the RDI produced a report for 40 public information measurements.
RDI Methodology
- Equipment Narda NBM 550
- Frequency range 100 KHz - 6 GHz
- Position One fixed point on tripod
- Height Fixed height 1.80m
- Duration 6 minutes continuous
- Measurement 1x average and maximum peak value
EMF Map Methodology
- Equipment Safe and Sound Pro II
- Frequency range 200 MHz - 8 GHz
- Position Four corners of an intersection
- Height Approximately 1.60–1.80m
- Duration 4 x 1.5 = 6 minutes
- Measurement 4x average and maximum peak value
Difference in methodology
For an RDI measurement, the radiation present in the surroundings is measured from one position for 6 minutes. The meter is placed on a wooden tripod at a height of 1.80 metres.
For an EMF Map measurement, an all-round measurement is taken at four corner points of an intersection. The total duration is approximately 1 to 1.5 minutes per corner point, 4 to 6 minutes in total. The staff member holds the meter with an outstretched arm, at approximately 1.60 to 1.80 metres height.
In the frequency spectrum, the RDI measures more at the lower end (> 100 KHz) and EMF Map slightly more at the upper end (< 8 GHz). In terms of height and time, the methods do not differ much.
Difference in measurement points
The main difference in methodology lies in the measurement points. The RDI chooses a fixed point for the measurement. EMF Map chooses four corner points of an intersection. The RDI method can result in positions being chosen that yield particularly high or low values, for example in line of sight of a mast. With EMF Map's method that is not possible. Because four corner points are always measured, there is much less room for bias. It is possible that one corner point in the line of sight of a mast gives high values, but rarely will that be the case at all four corner points. The method thereby provides a fairer and more balanced picture of the measurement point than the RDI method.
Comparison at six locations
In the period 2021–2024, measurements were taken at six locations by both the RDI and EMF Map NL. The results per location are shown below.
Waagplein in Sneek
The distance relative to the antenna installation is comparable. Equally far from the mast and with comparable buildings and sightlines. Both measurements took place in the second half of 2023. The maximum peak values of RDI and EMF Map are close to each other.
| RDI (Aug 2023) | EMF Map (Sep 2023) | |
|---|---|---|
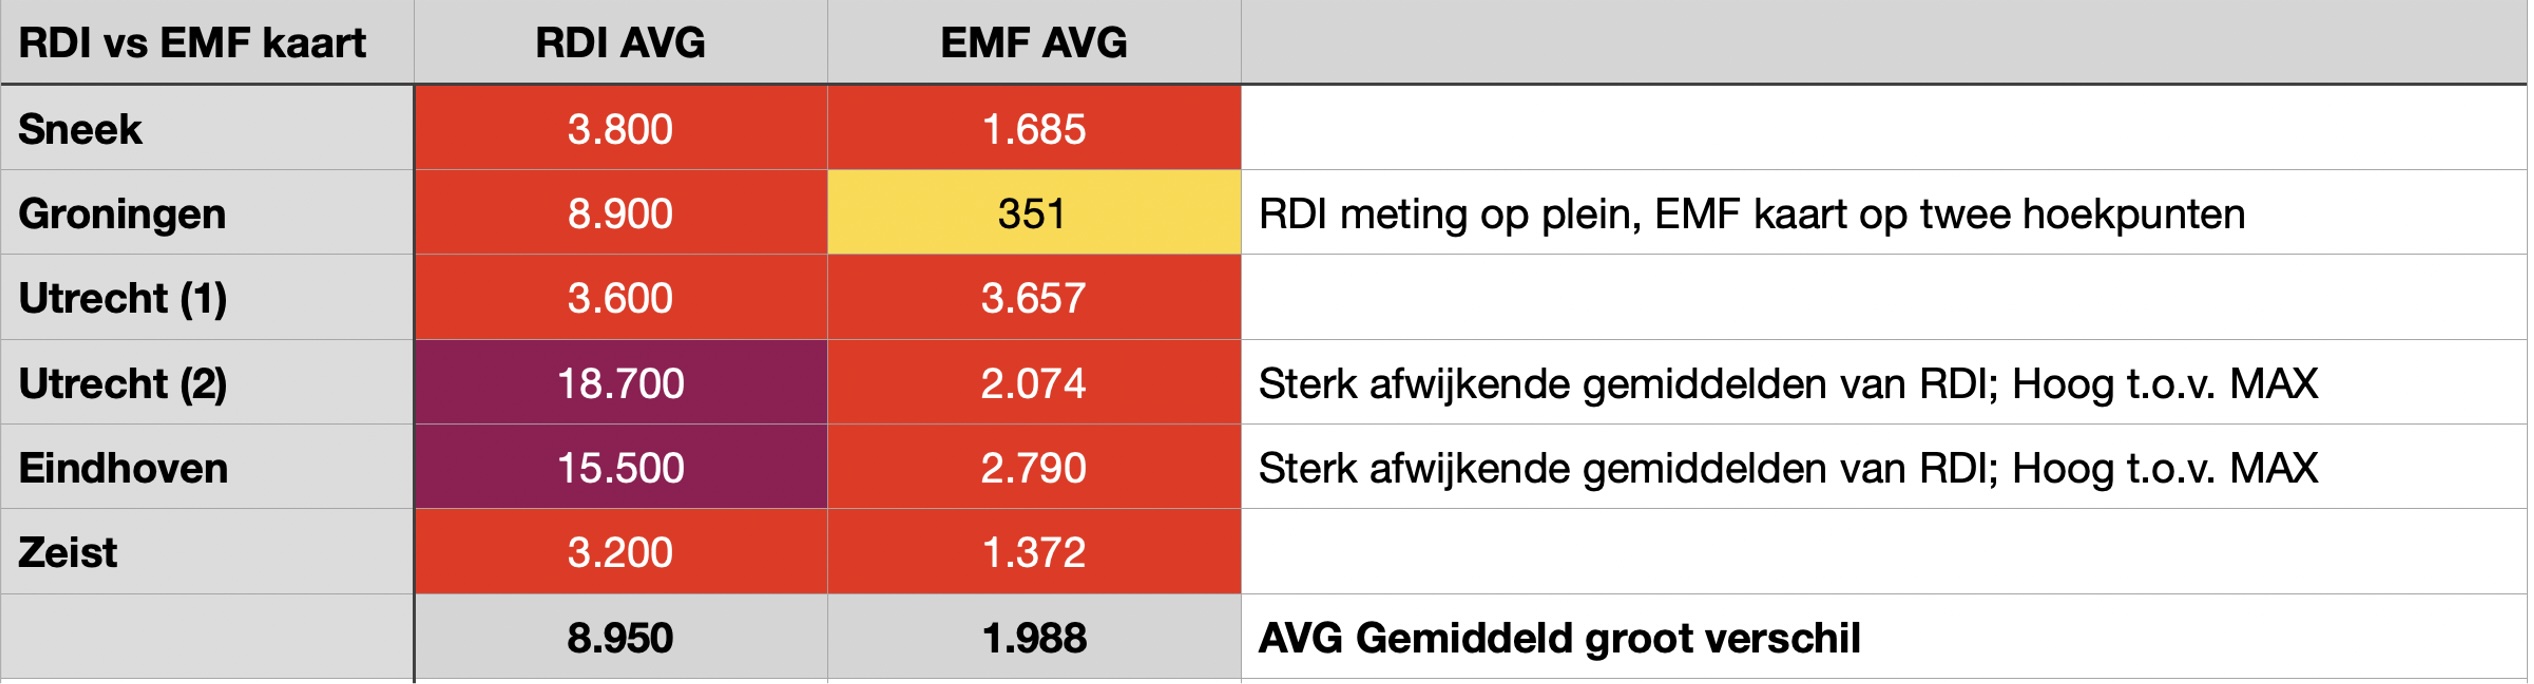
| AVG | 3.800 μW/m² | 1.685 μW/m² |
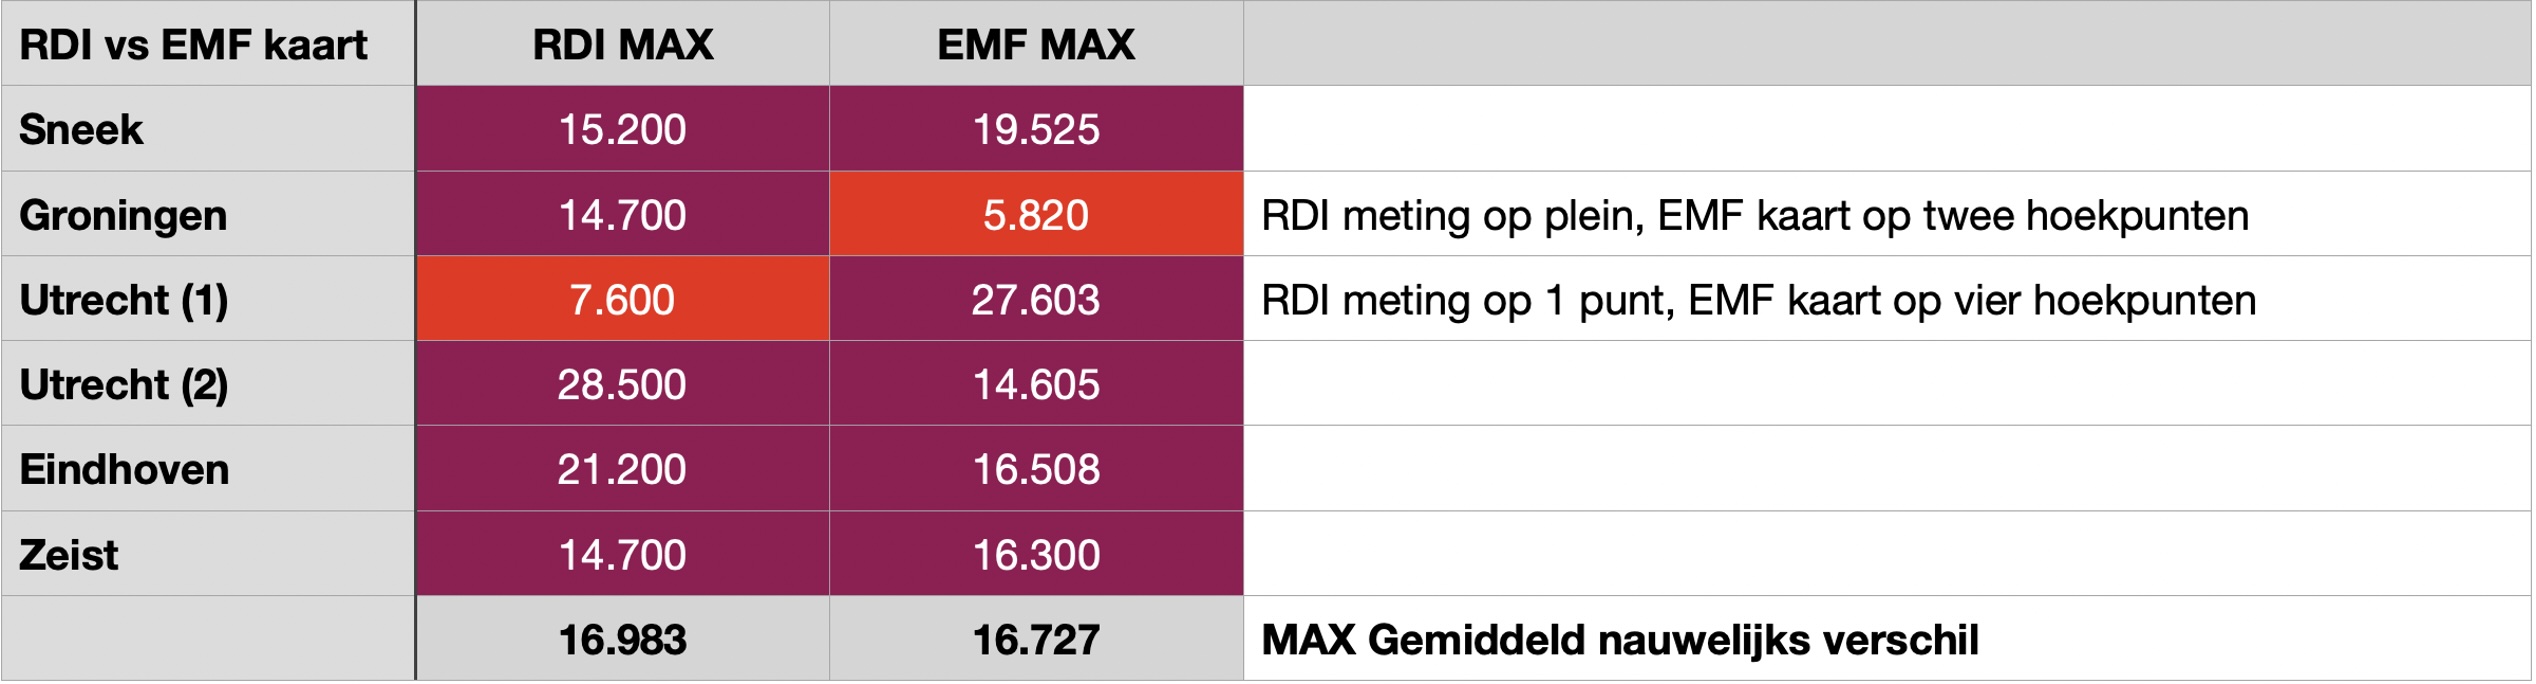
| MAX | 15.200 μW/m² | 19.525 μW/m² |
Maximum peak value comparable in same range.
Grote Markt in Groningen
The position of the measurements here is not well comparable. The RDI measured in the middle of the square, in sight of multiple antenna installations. EMF Map measured at two corners of the square. Because there are no direct sightlines to the antenna installations there, the measurements are considerably lower.
| RDI (Mar 2023) | EMF Map (Aug 2024) | |
|---|---|---|
| AVG | 8.900 μW/m² | 350 μW/m² |
| MAX | 14.700 μW/m² | 5.000 μW/m² |
Higher RDI values explainable by line of sight to antennas.
Oudegracht in Utrecht
Here too there is a large difference in position. The RDI measured 20 metres beside the bridge, on the canal. EMF Map measured at four corner points of the bridge, with an unobstructed view towards the main streets. Because antenna installations are on three different rooftops around the intersection, the effect of this is visible in the EMF Map measurements.
| RDI (Jun 2022) | EMF Map (Jul 2023) | |
|---|---|---|
| AVG | 3.600 μW/m² | 3.657 μW/m² |
| MAX | 7.600 μW/m² | 27.603 μW/m² |
Higher values explainable by line of sight to antennas.
A.v. Schendelstraat in Utrecht
The RDI measured here on a balcony. So not at 1.80m above ground level. The EMF Map measurement at the end of the street, at 1.80m ground level (between the buildings), therefore falls lower. The average radiation seems disproportionately high relative to the peak value for the RDI.
| RDI (Nov 2022) | EMF Map (Apr 2024) | |
|---|---|---|
| AVG | 18.700 μW/m² | 2.074 μW/m² |
| MAX | 28.500 μW/m² | 14.605 μW/m² |
Height difference explains the difference in values.
Stationsplein in Eindhoven
Both the RDI and EMF Map chose the same position here, except that EMF Map measured at four corner points. The only complication is that the RDI measurement was taken in 2022 and the EMF Map measurement at the end of June 2024, by which time the new frequencies may already be playing a role. Yet they are comparable in maximum peak value. The average radiation for the RDI is extremely high, higher than would be expected at such a peak value. This appears to be an erroneously recorded value.
| RDI (Nov 2022) | EMF Map (Jun 2024) | |
|---|---|---|
| AVG | 15.500 μW/m² | 2.790 μW/m² |
| MAX | 21.200 μW/m² | 16.508 μW/m² |
Maximum peak values comparable.
Rozenstraat in Zeist
Directly beneath an antenna installation in the church, both the RDI and EMF Map measured. The RDI stood at a corner point, and EMF Map measured at four corner points.
| RDI (Apr 2021) | EMF Map (May 2022) | |
|---|---|---|
| AVG | 3.200 μW/m² | 1.372 μW/m² |
| MAX | 14.700 μW/m² | 16.300 μW/m² |
Measurement results are in good agreement.
Differences in position
In three of the six measurements, the positions of the measurements are less well comparable. In Groningen and for the two measurements in Utrecht there are differences in position and height, which affect the measurement results. The higher values are explainable by the stronger or weaker influence of antenna installations in the vicinity.
Differences in average AVG
In two cases, the RDI measurements indicate a very high average radiation (AVG), for the station in Eindhoven and for the balcony measurement in Utrecht. The level of the AVG is such that it approaches the maximum peak value. This appears to be an erroneous notation rather than an actually measured value.
Conclusion
The six measurements differ little in measured values when we look at the colour scale of the EMF Map. Of the twelve values, only three times is there a different colour for the average radiation. Twice there is a different colour for the maximum peak value. These differences are explainable, as described.
The measured values of EMF Map are well comparable to those of the RDI. The EMF Map measurements therefore form — despite the use of a consumer meter — a good indication of the actual radiation levels in the Netherlands.