Analysis
Statistics and trends of the measurements
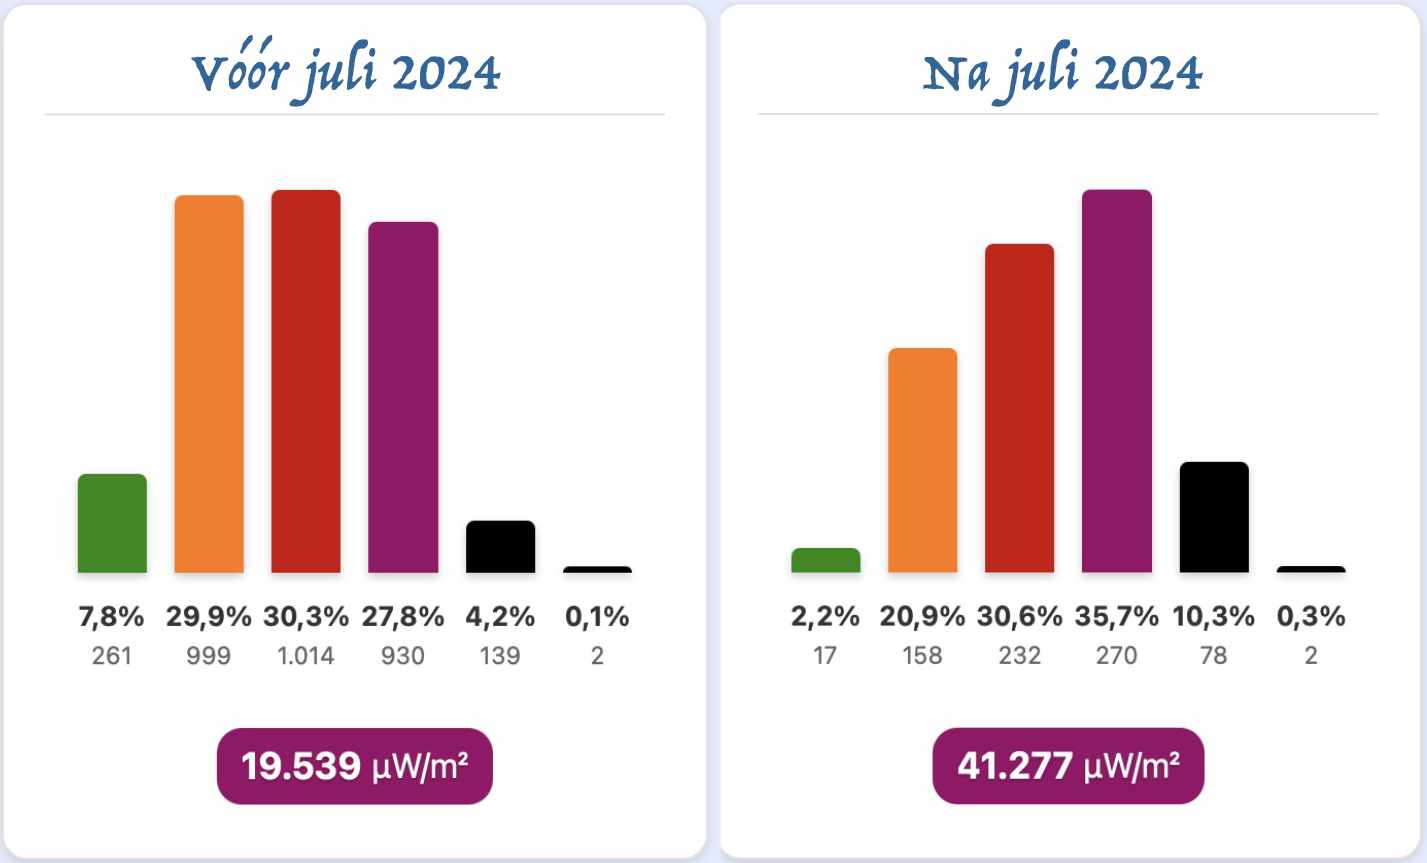
Impact Analysis 3.5GHz
EMF Map NL has conducted extensive analyses into the effects of the introduction of the 3.5GHz frequency band in the summer of 2024. At the same time as the new frequencies, the network was also renewed. The upgrade has led to significantly more radiation. Since September last year, the average peak value has doubled, from 20,121 to 41,793 µW/m².
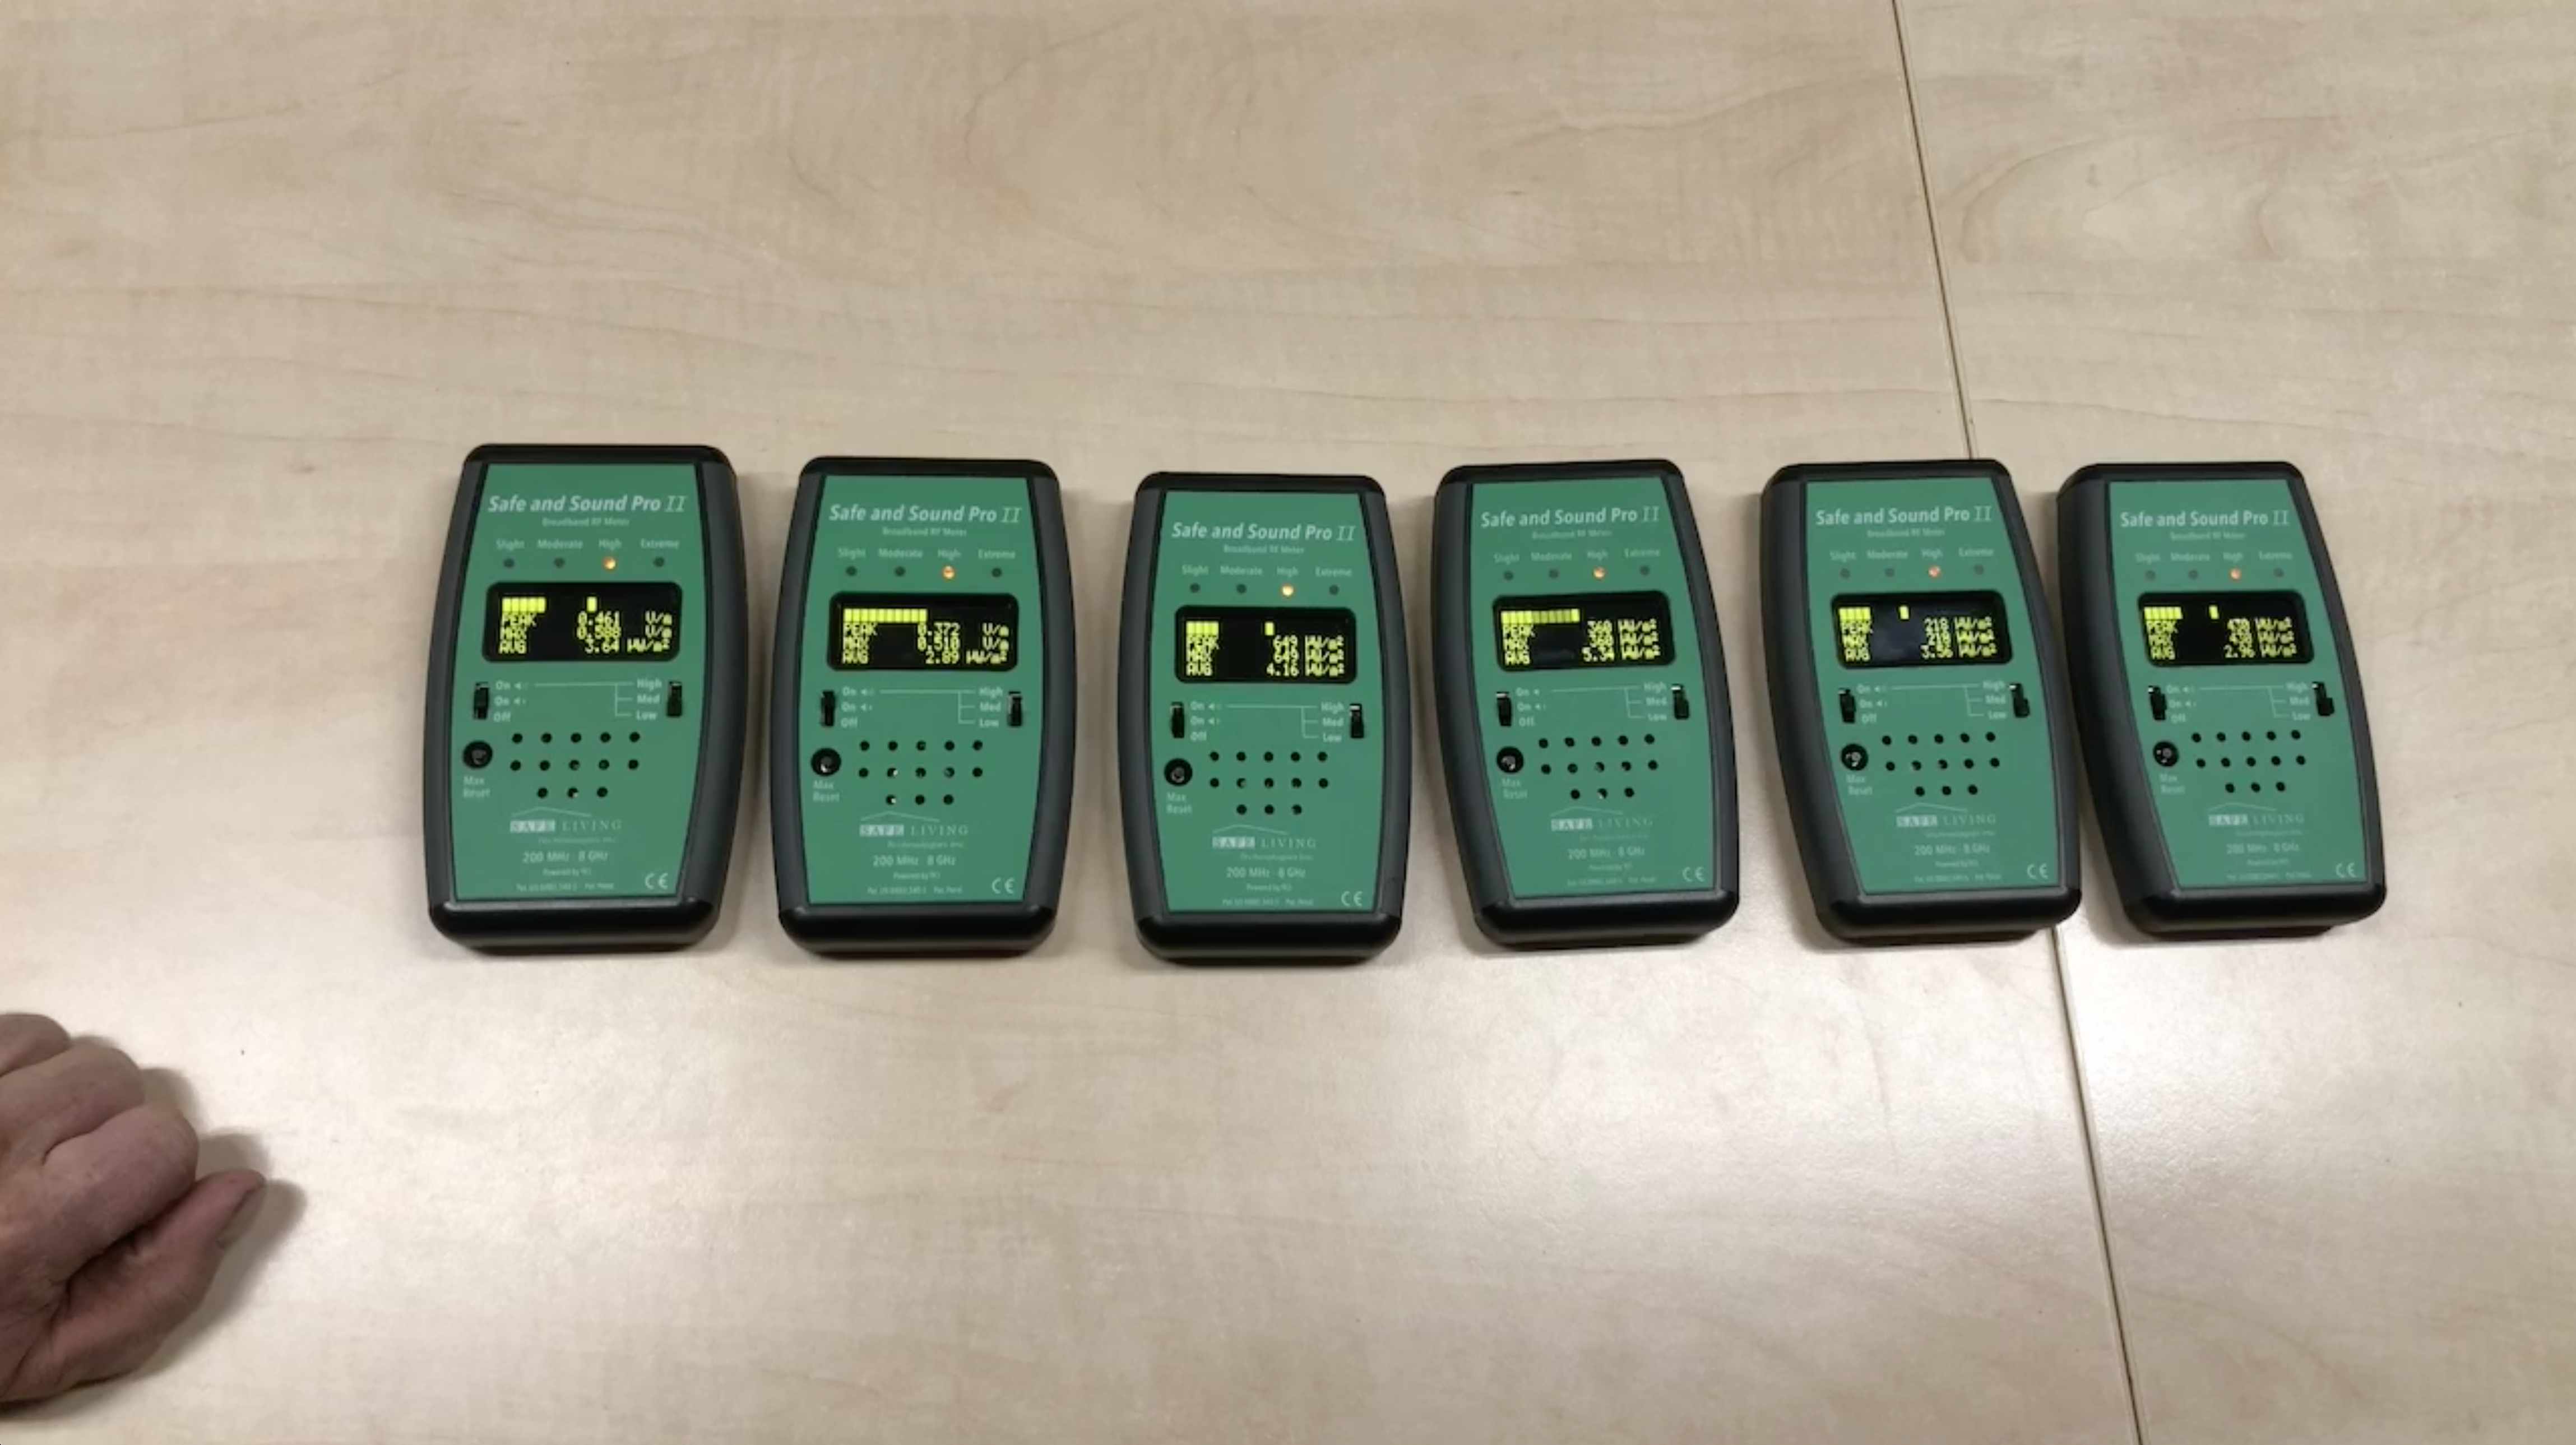
Comparison Safe and Sound Pro II
For EMF Map, the radiation meter Safe and Sound Pro II is used. Each meter is calibrated by an independent laboratory. The meter remains, however, a consumer meter and is therefore not as exact and precise as professional measurement equipment. To get an idea of the accuracy of the meter, comparative measurements were conducted with multiple units of the Safe and Sound Pro II. These tests showed that the measurement results are in good agreement with each other.
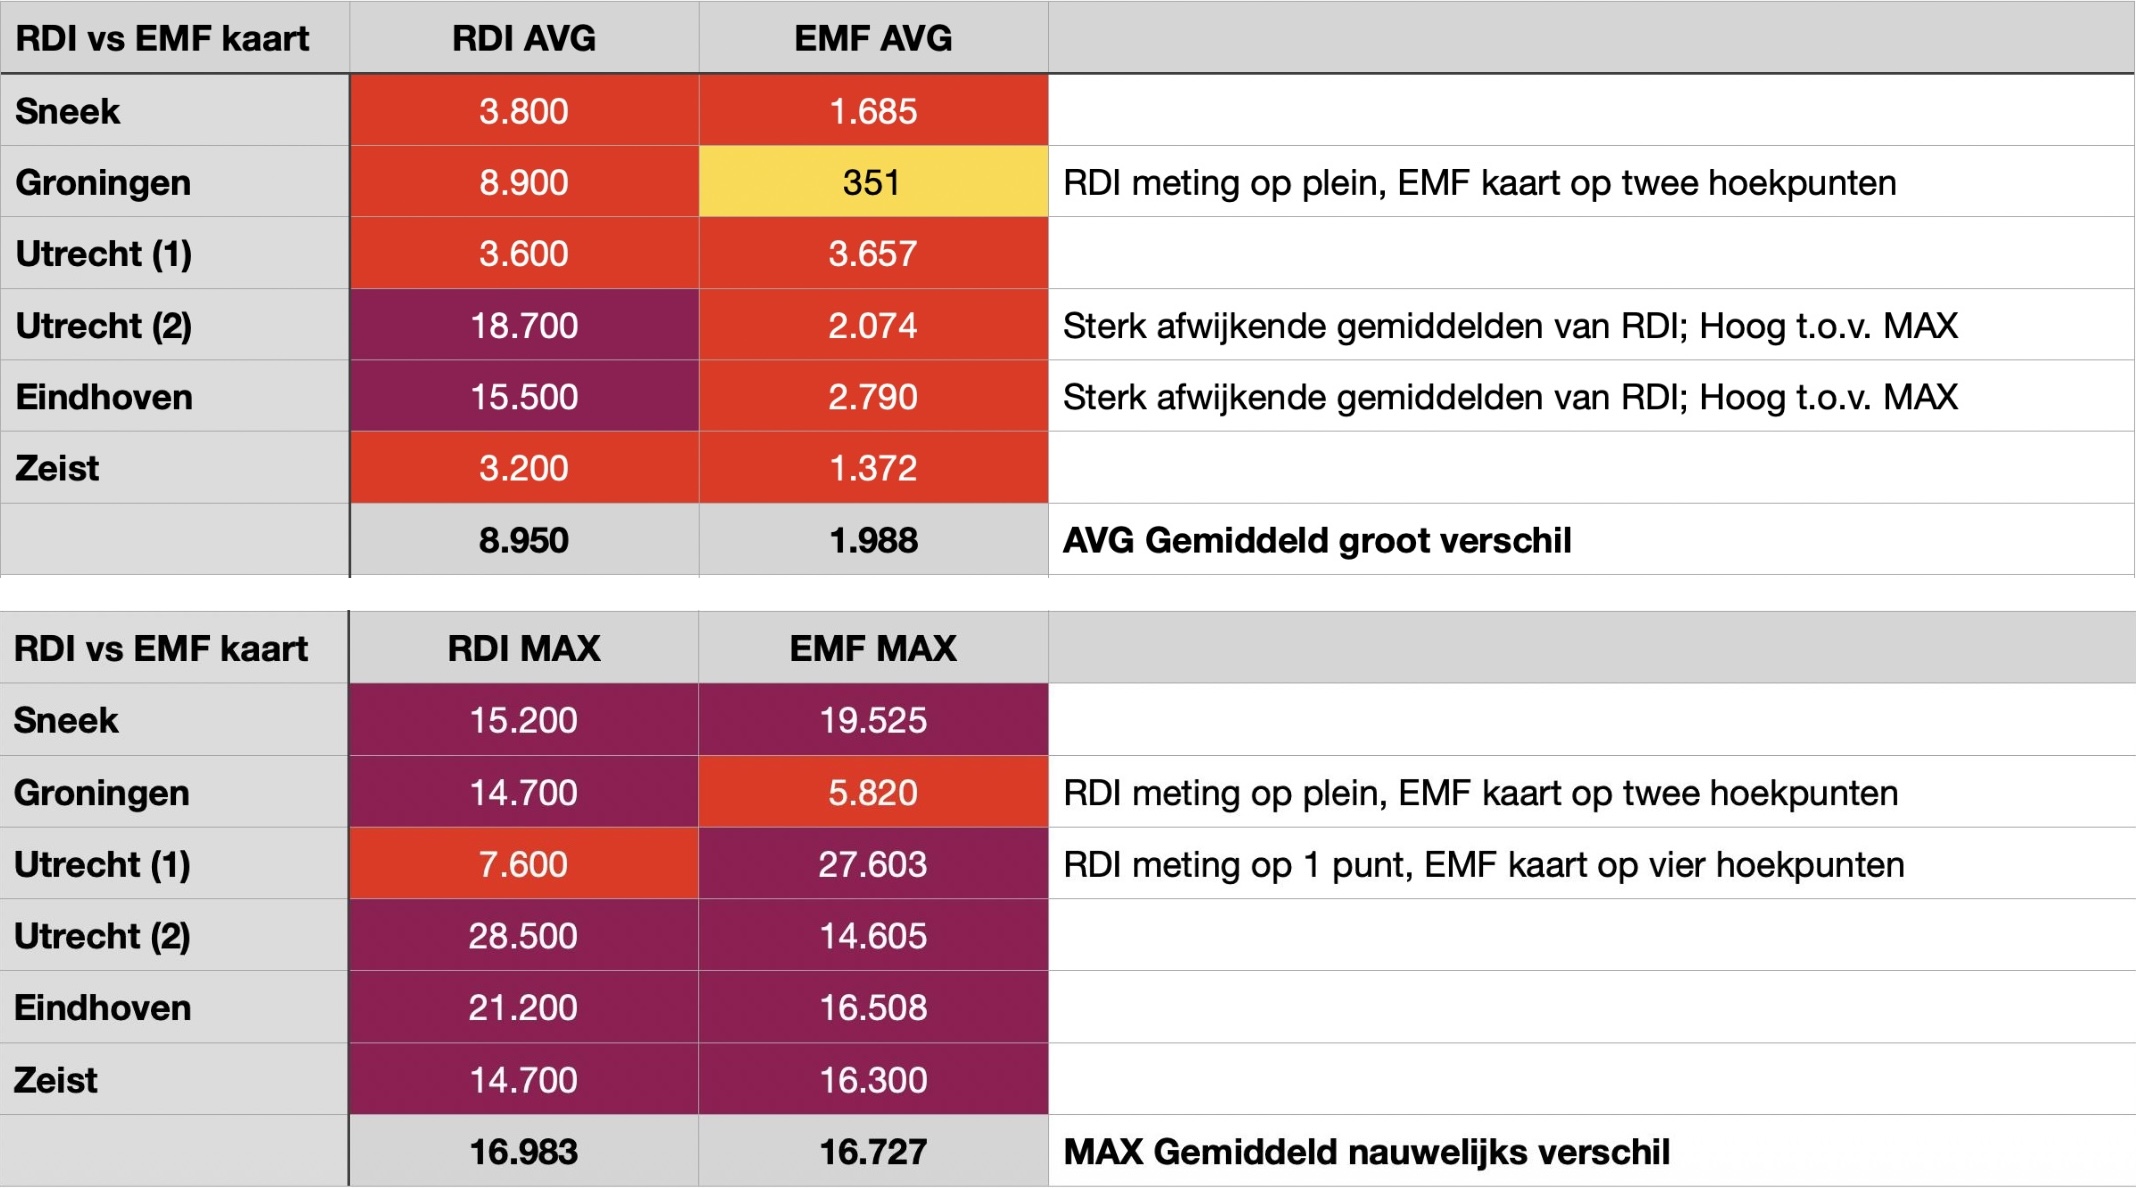
RDI and EMF Map Test Results Compared
Each year the RDI (National Service for Digital Infrastructure) performs approximately 200 measurements of radiation levels in the Netherlands. EMF Map NL has compared the measurement results of the RDI with its own measurements. At six locations, measurements were performed by both parties. Most results are in good agreement, and where there are deviations, these are explainable.