Impact Analysis 3.5GHz
Research into the effects of the introduction of 3.5GHz
EMF Map NL has conducted two extensive analyses to map the effects of the introduction of the 3.5GHz frequency. In the first study, measurements were taken at locations before and after the introduction, so-called repeat measurements. In the second study, all measurement data was examined for trends and changes. Both studies point in the same direction: a doubling of EMF radiation since the introduction of 3.5GHz, summer 2024.
Introduction of 3.5GHz
On 10 July 2024, provider Odido was the first to switch on the new network for 5G. The other two providers (KPN and Vodafone) followed shortly after. The arrival of the new frequency was accompanied by the rollout of new technology. In the months preceding the introduction, intensive work was done on the infrastructure. New antennas were placed and existing antennas upgraded. So it is not only the 3.5GHz frequency, but also the infrastructure that has been improved.
Radiation values of antenna installations
| 700-1500 m | 400-700 m | 200-400 m | 100-200 m | 0-100 m 0-3 ANTs | 0-100 m 4-9 ANTs | 0-100 m 10+ ANTs | |
|---|---|---|---|---|---|---|---|
|
Before 3.5 GHz
n = 3.034
|
248 | 384 | 2.390 | 11.540 | 16.383 | 37.850 | 71.350 |
|
After 3.5 GHz
n = 2.222
|
334 | 848 | 4.650 | 25.475 | 30.688 | 58.034 | 163.725 |
| Factor | ×1,34 | ×2,21 | ×1,95 | ×2,21 | ×1,87 | ×1,53 | ×2,29 |
Median power flux density in microwatts per square metre (µW/m²), as measured before the introduction of 3.5 GHz and since then, broken down by distance and antenna density (number of antenna installations, ANTs). Based on all published measurements from EMF Map NL and telecom antennas from the Dutch Antenna Register (Antenneregister). Excluding anomalies and measurements at defence radar sites. Split date before/after 3.5 GHz: 10-07-2024.
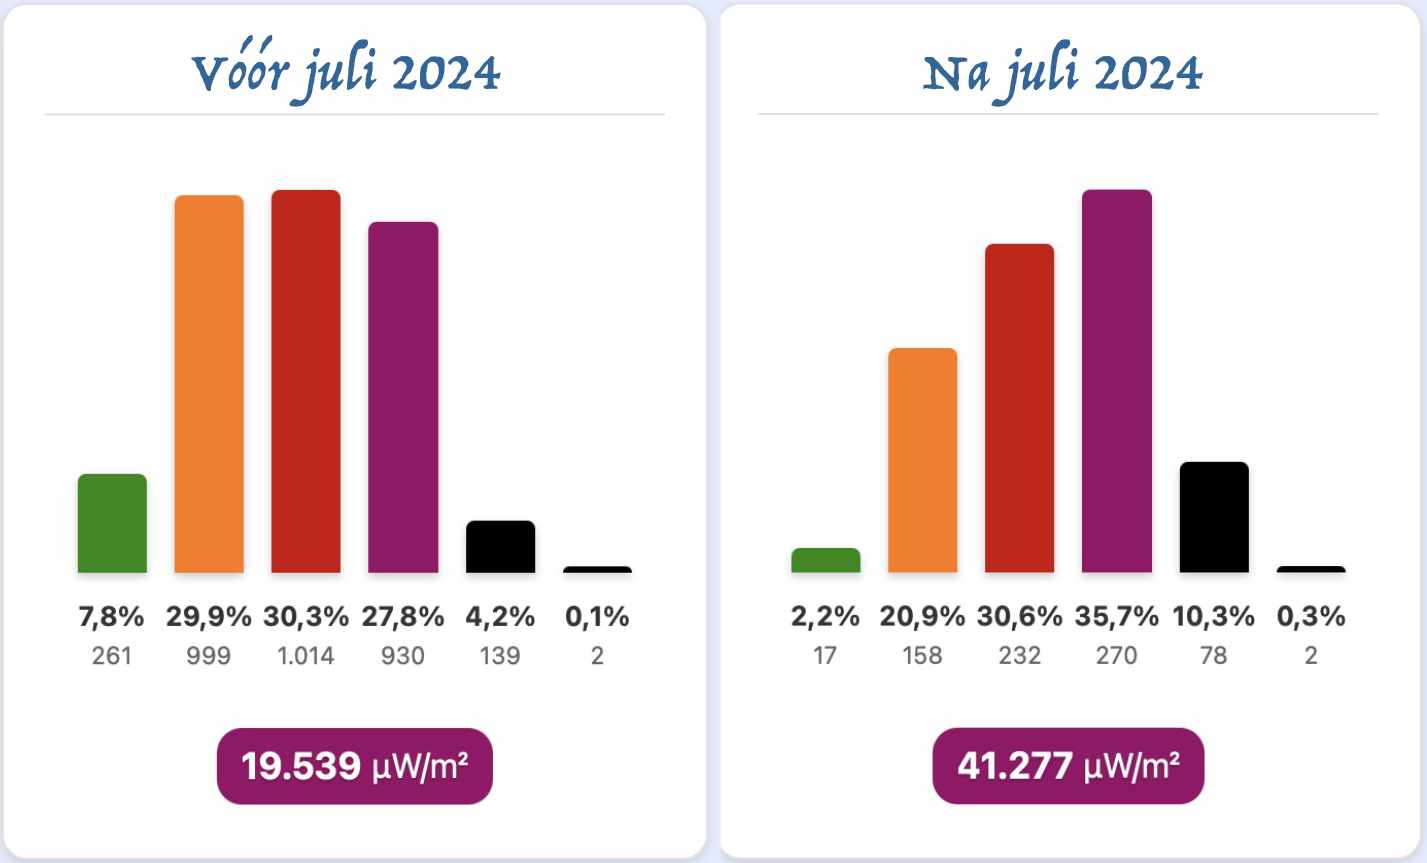
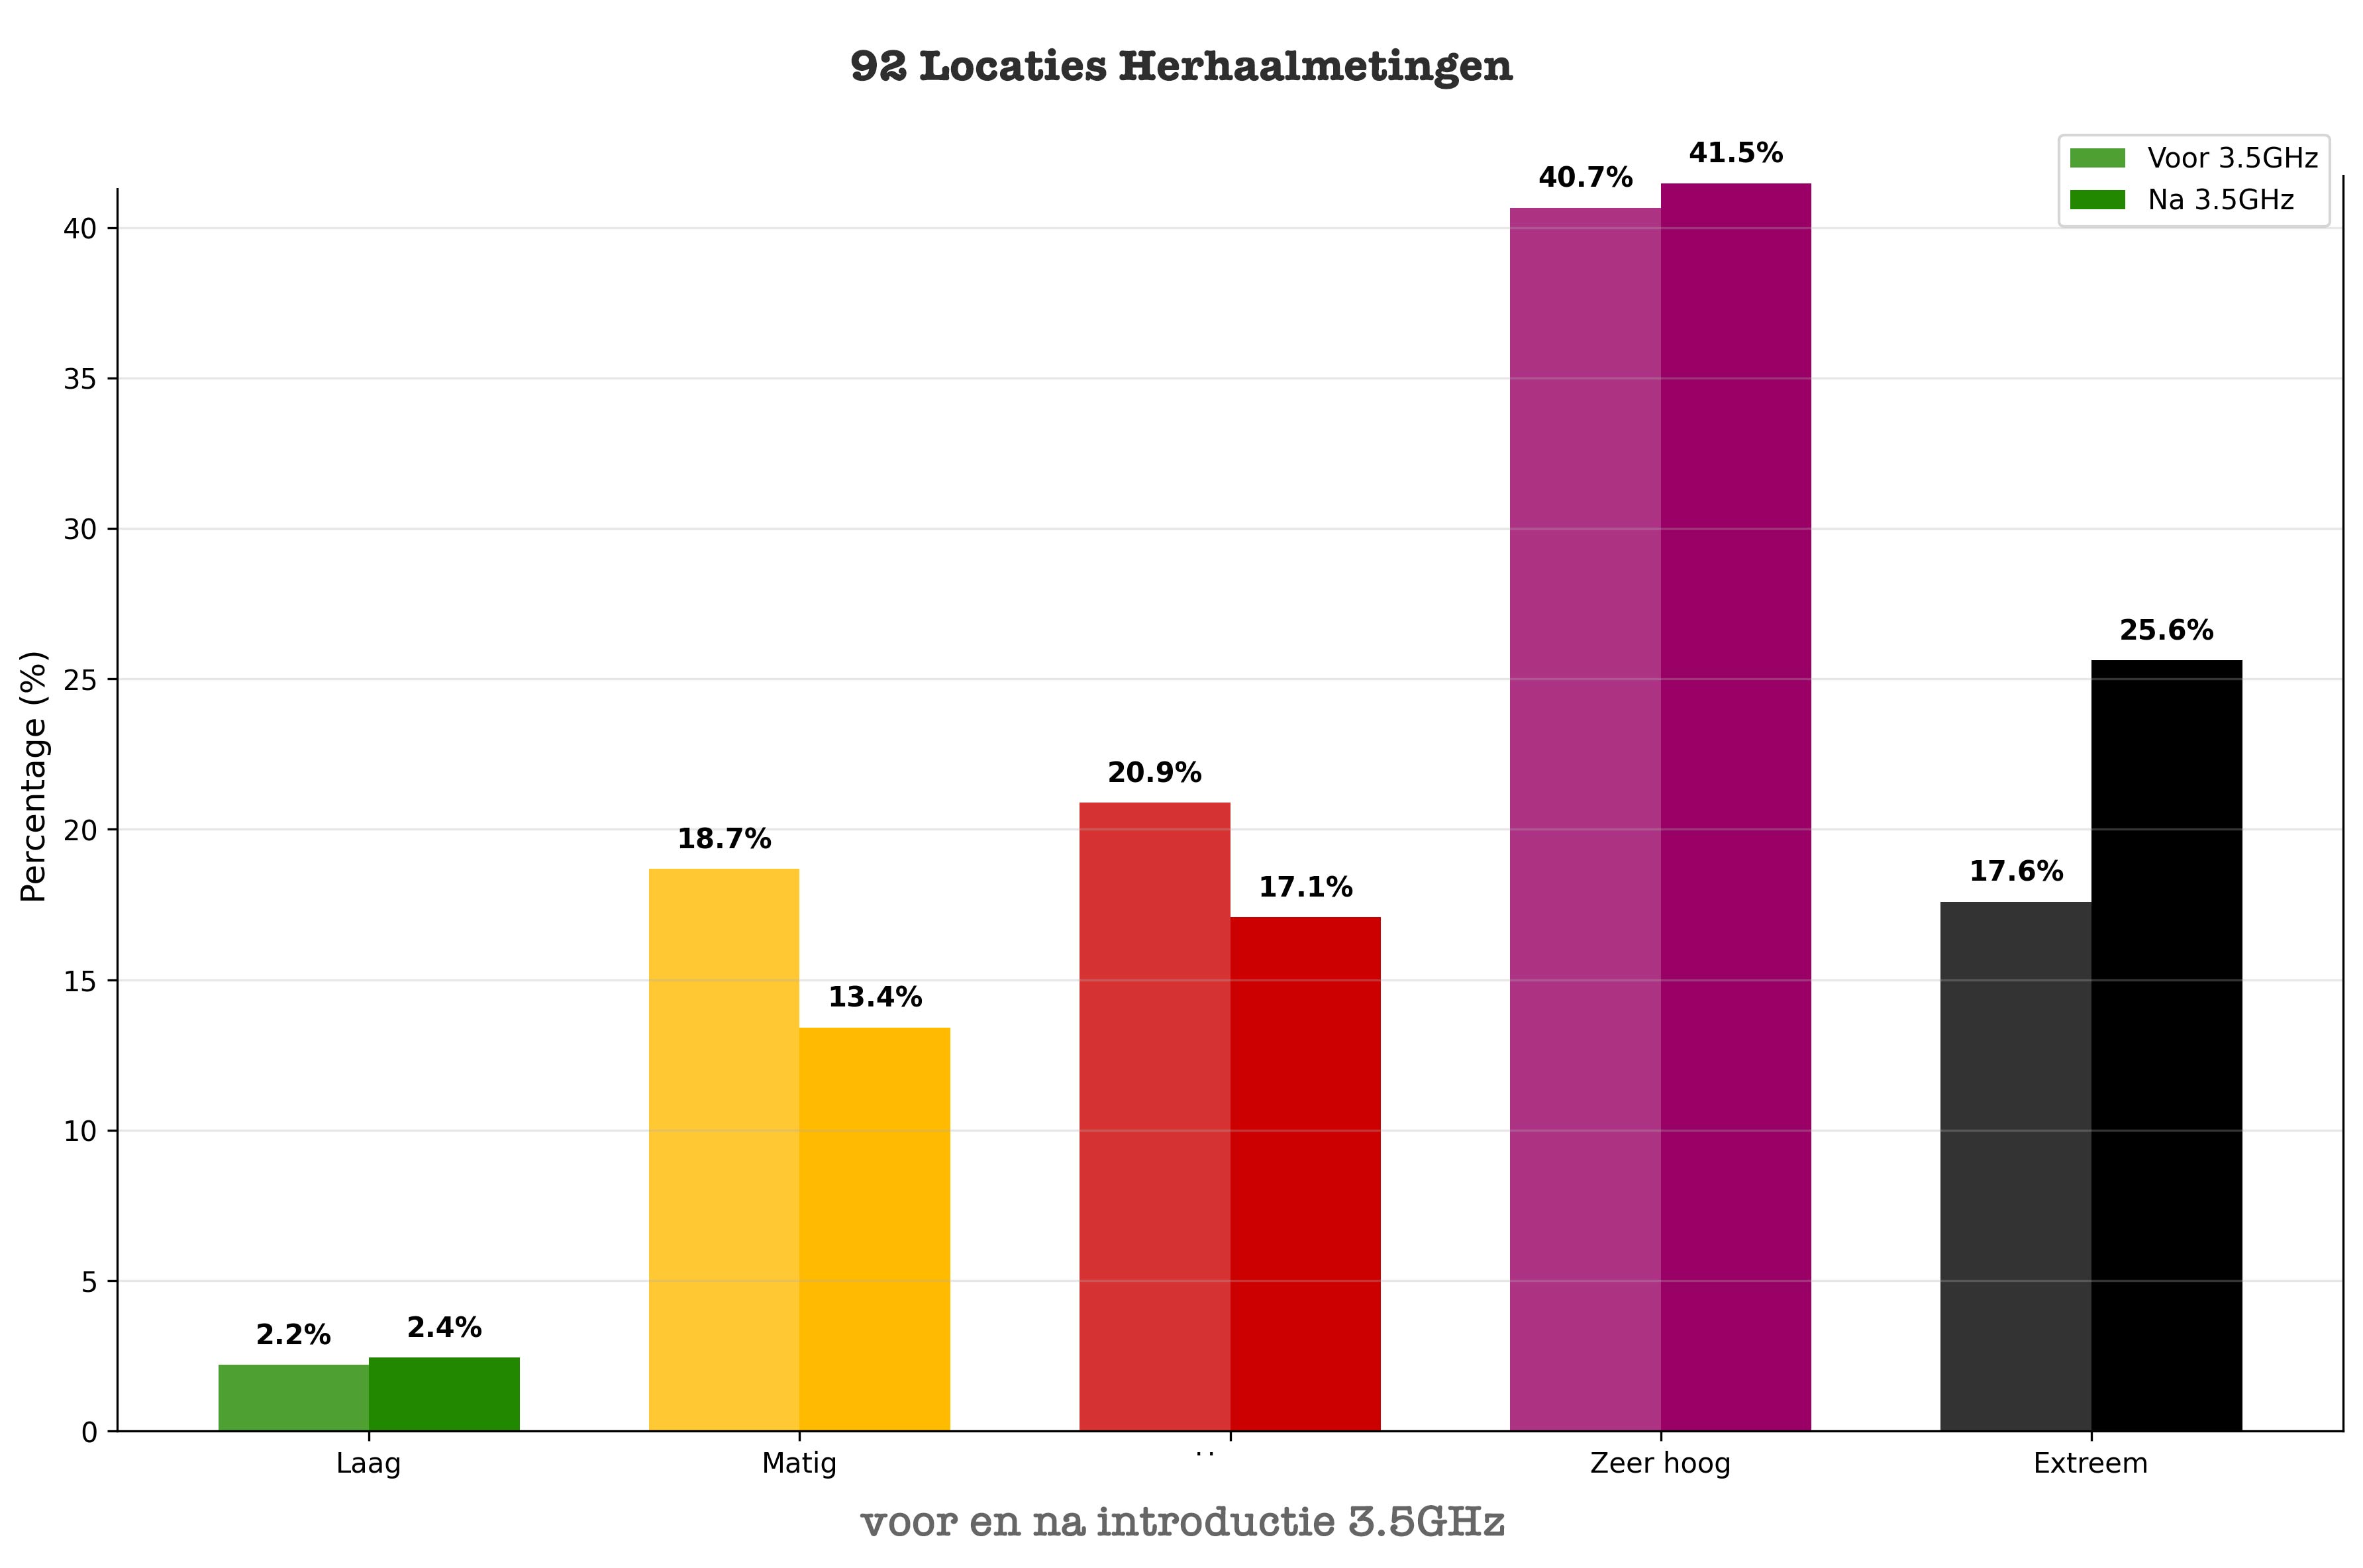
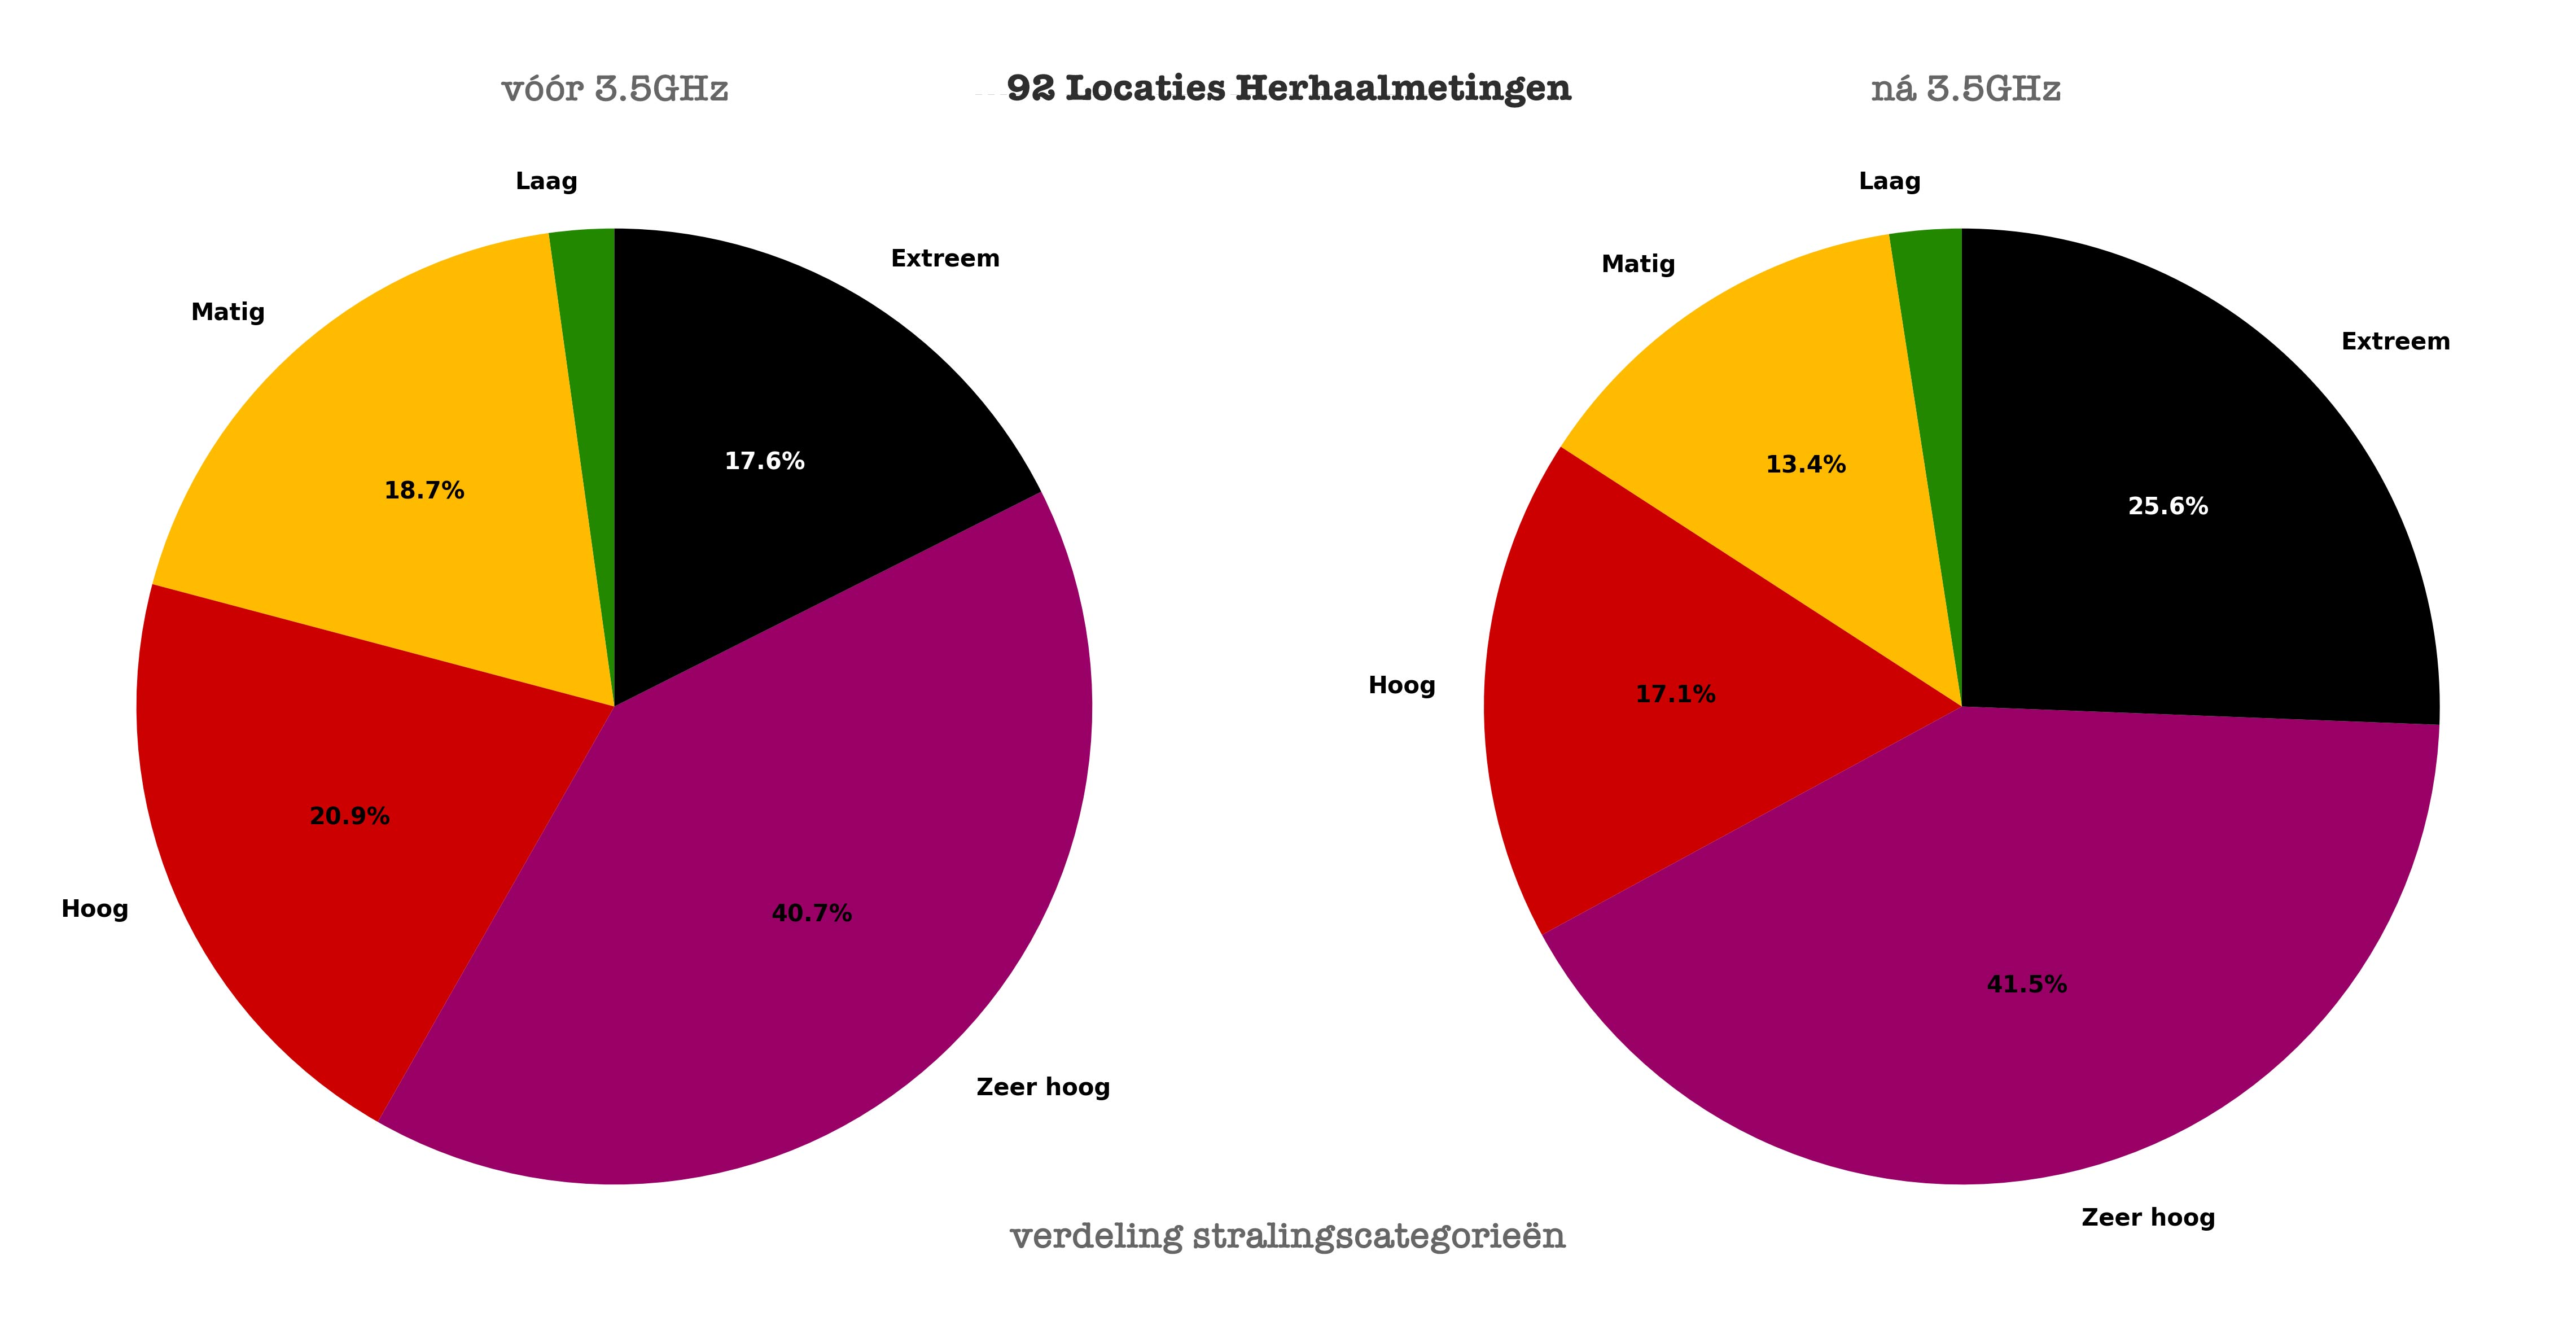
🔄 Repeat Measurements Analysis
Detailed comparison of 92 locations measured both before and after the introduction.
Key Figures
- Increase by a factor of 2.8x
- Average increase: +173.3%
- Higher radiation at 80.4% of locations
- Extreme category increase +45%
- Median increase 108%
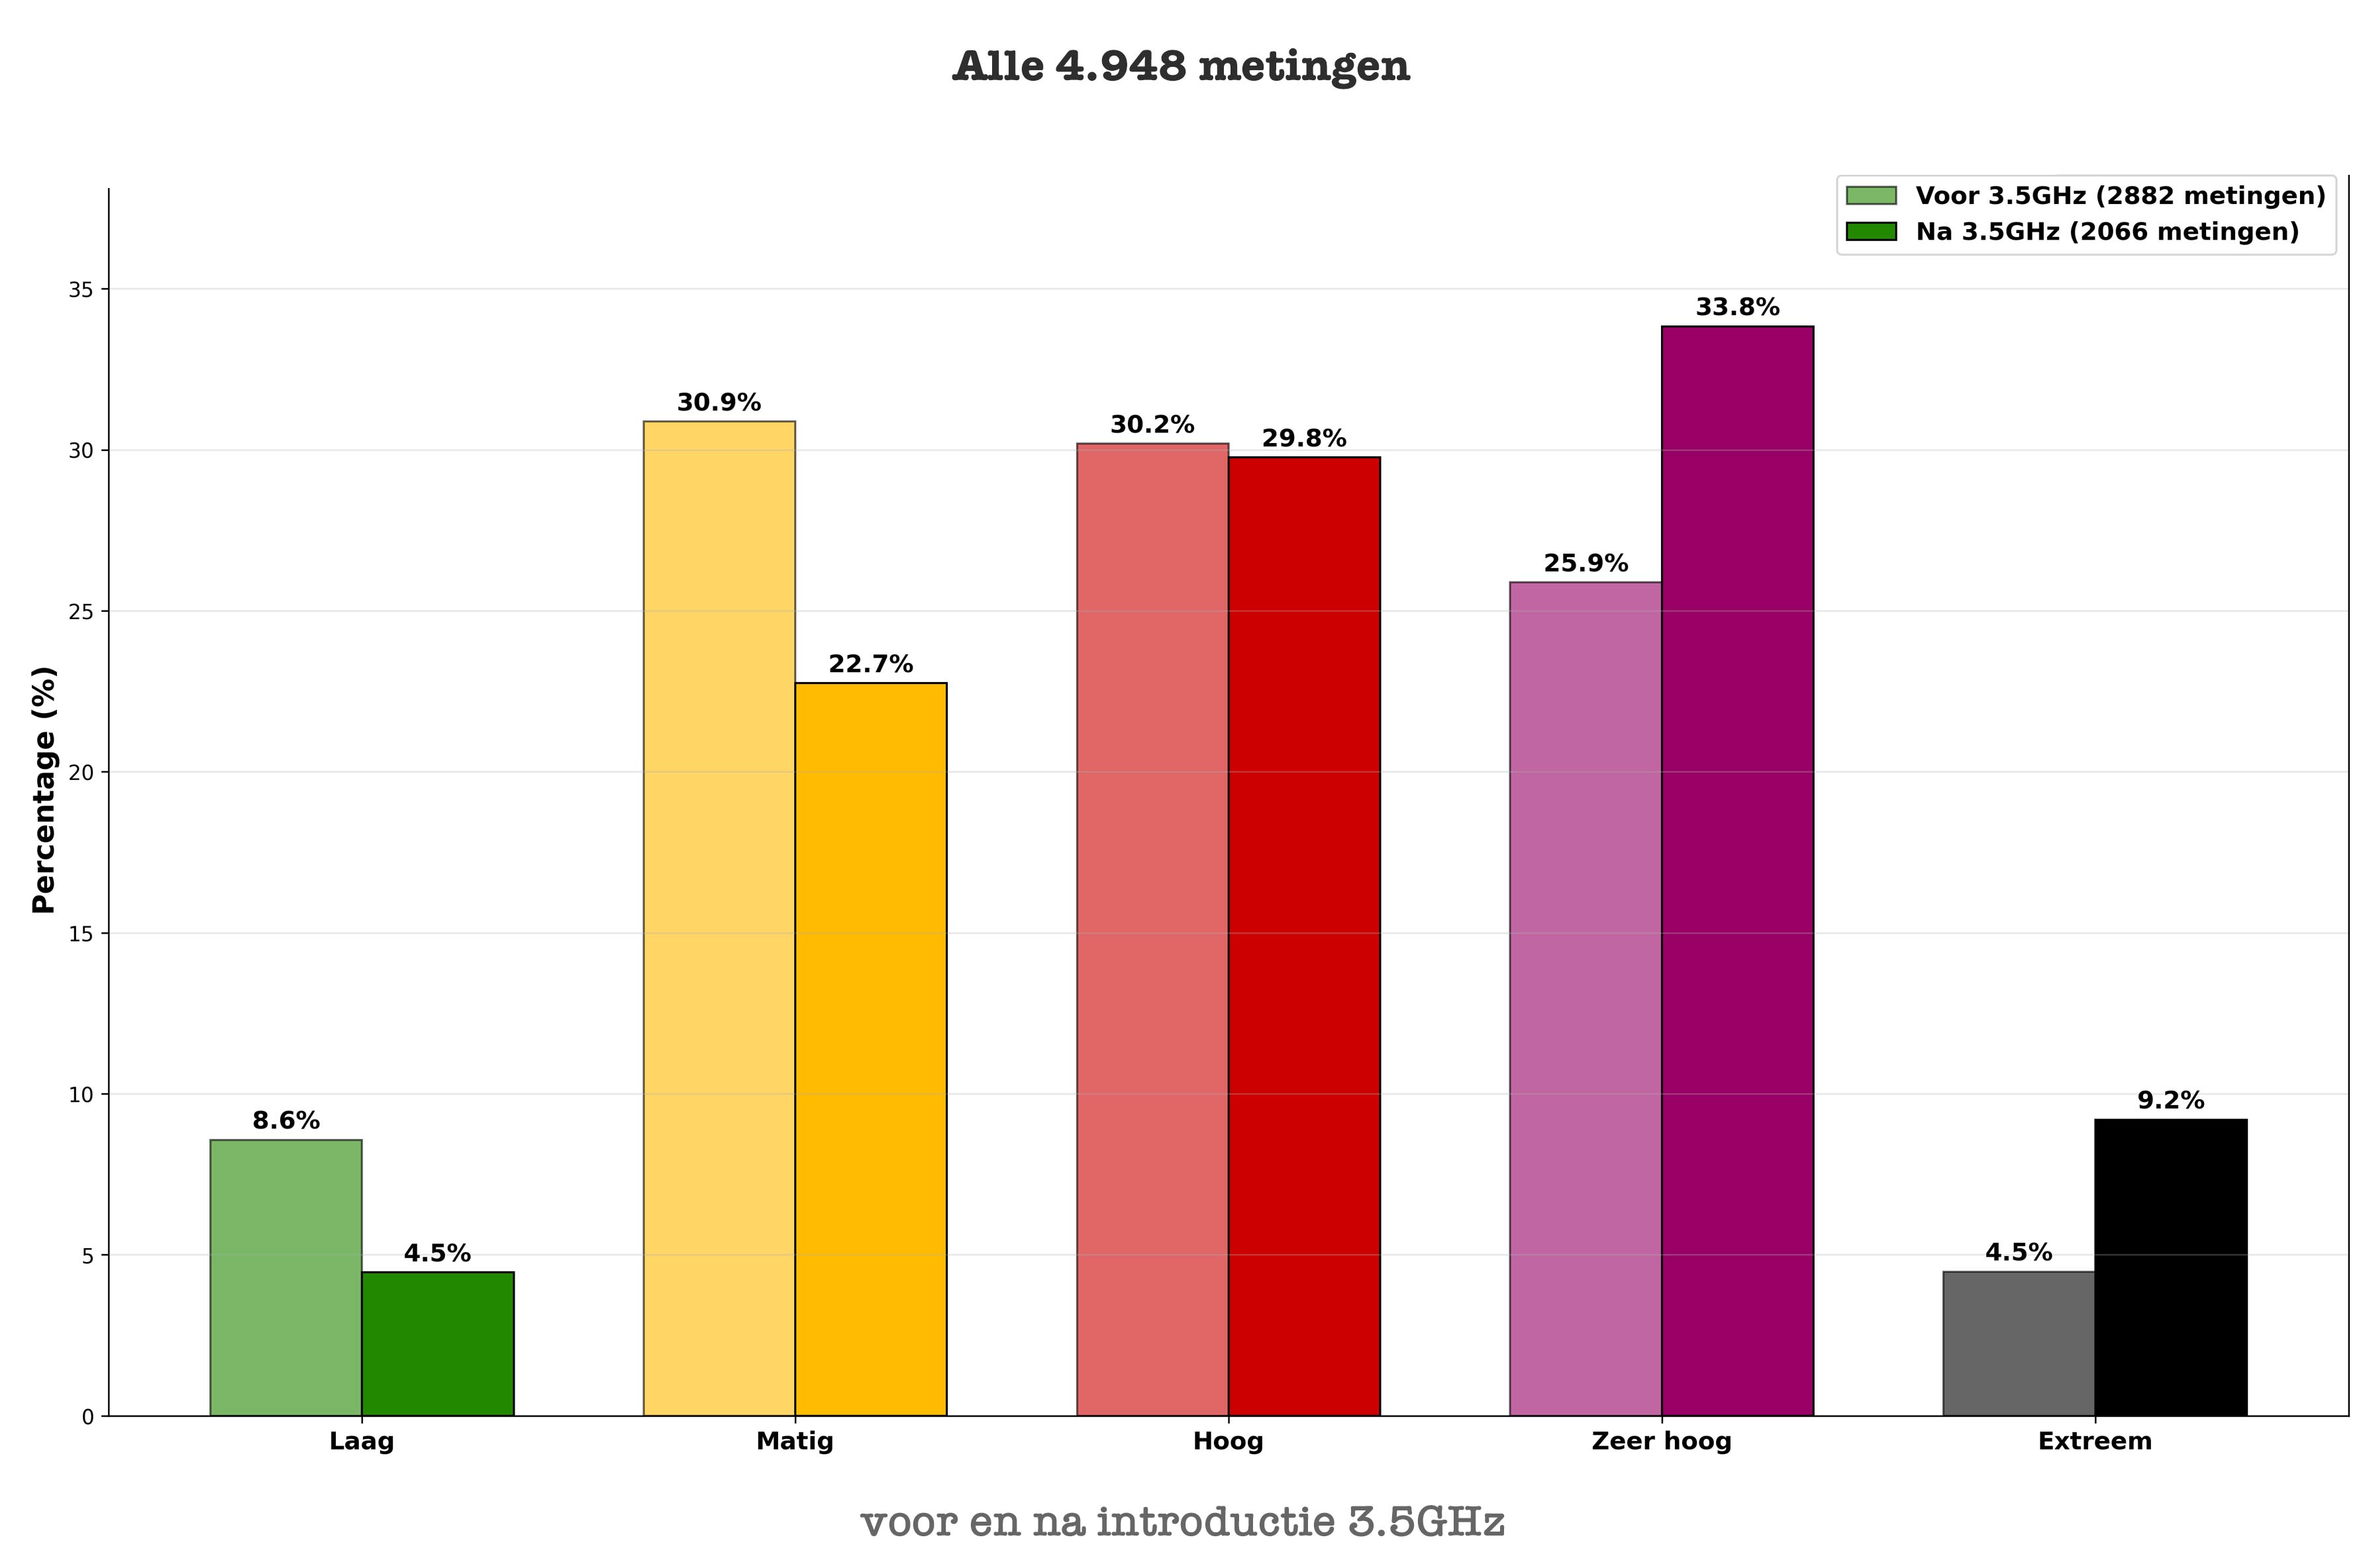
📊 All Measurement Data Analysis
Analysis of all 4,948 measurements in the Netherlands. Before and after the introduction of 3.5GHz
Key Figures
- Increase by a factor of 1.8x
- Average increase of 82%
- 31% decrease in low and moderate radiation
- Extreme category increase +104%
- Median increase 160%
🔬 Methodology & Reliability
- Calibrated equipment: Safe and Sound Pro II radiation meters
- Standardized protocol: Fixed methodology for 1-point and 4-point measurements
- Trained volunteers: Precise reproducible execution
- Transparent data: Full datasets available
- Clean comparison: Measurements near defense radar excluded
⚖️ Repeat Measurements before and after summer 2024
⚖️ All measurements before and after summer 2024
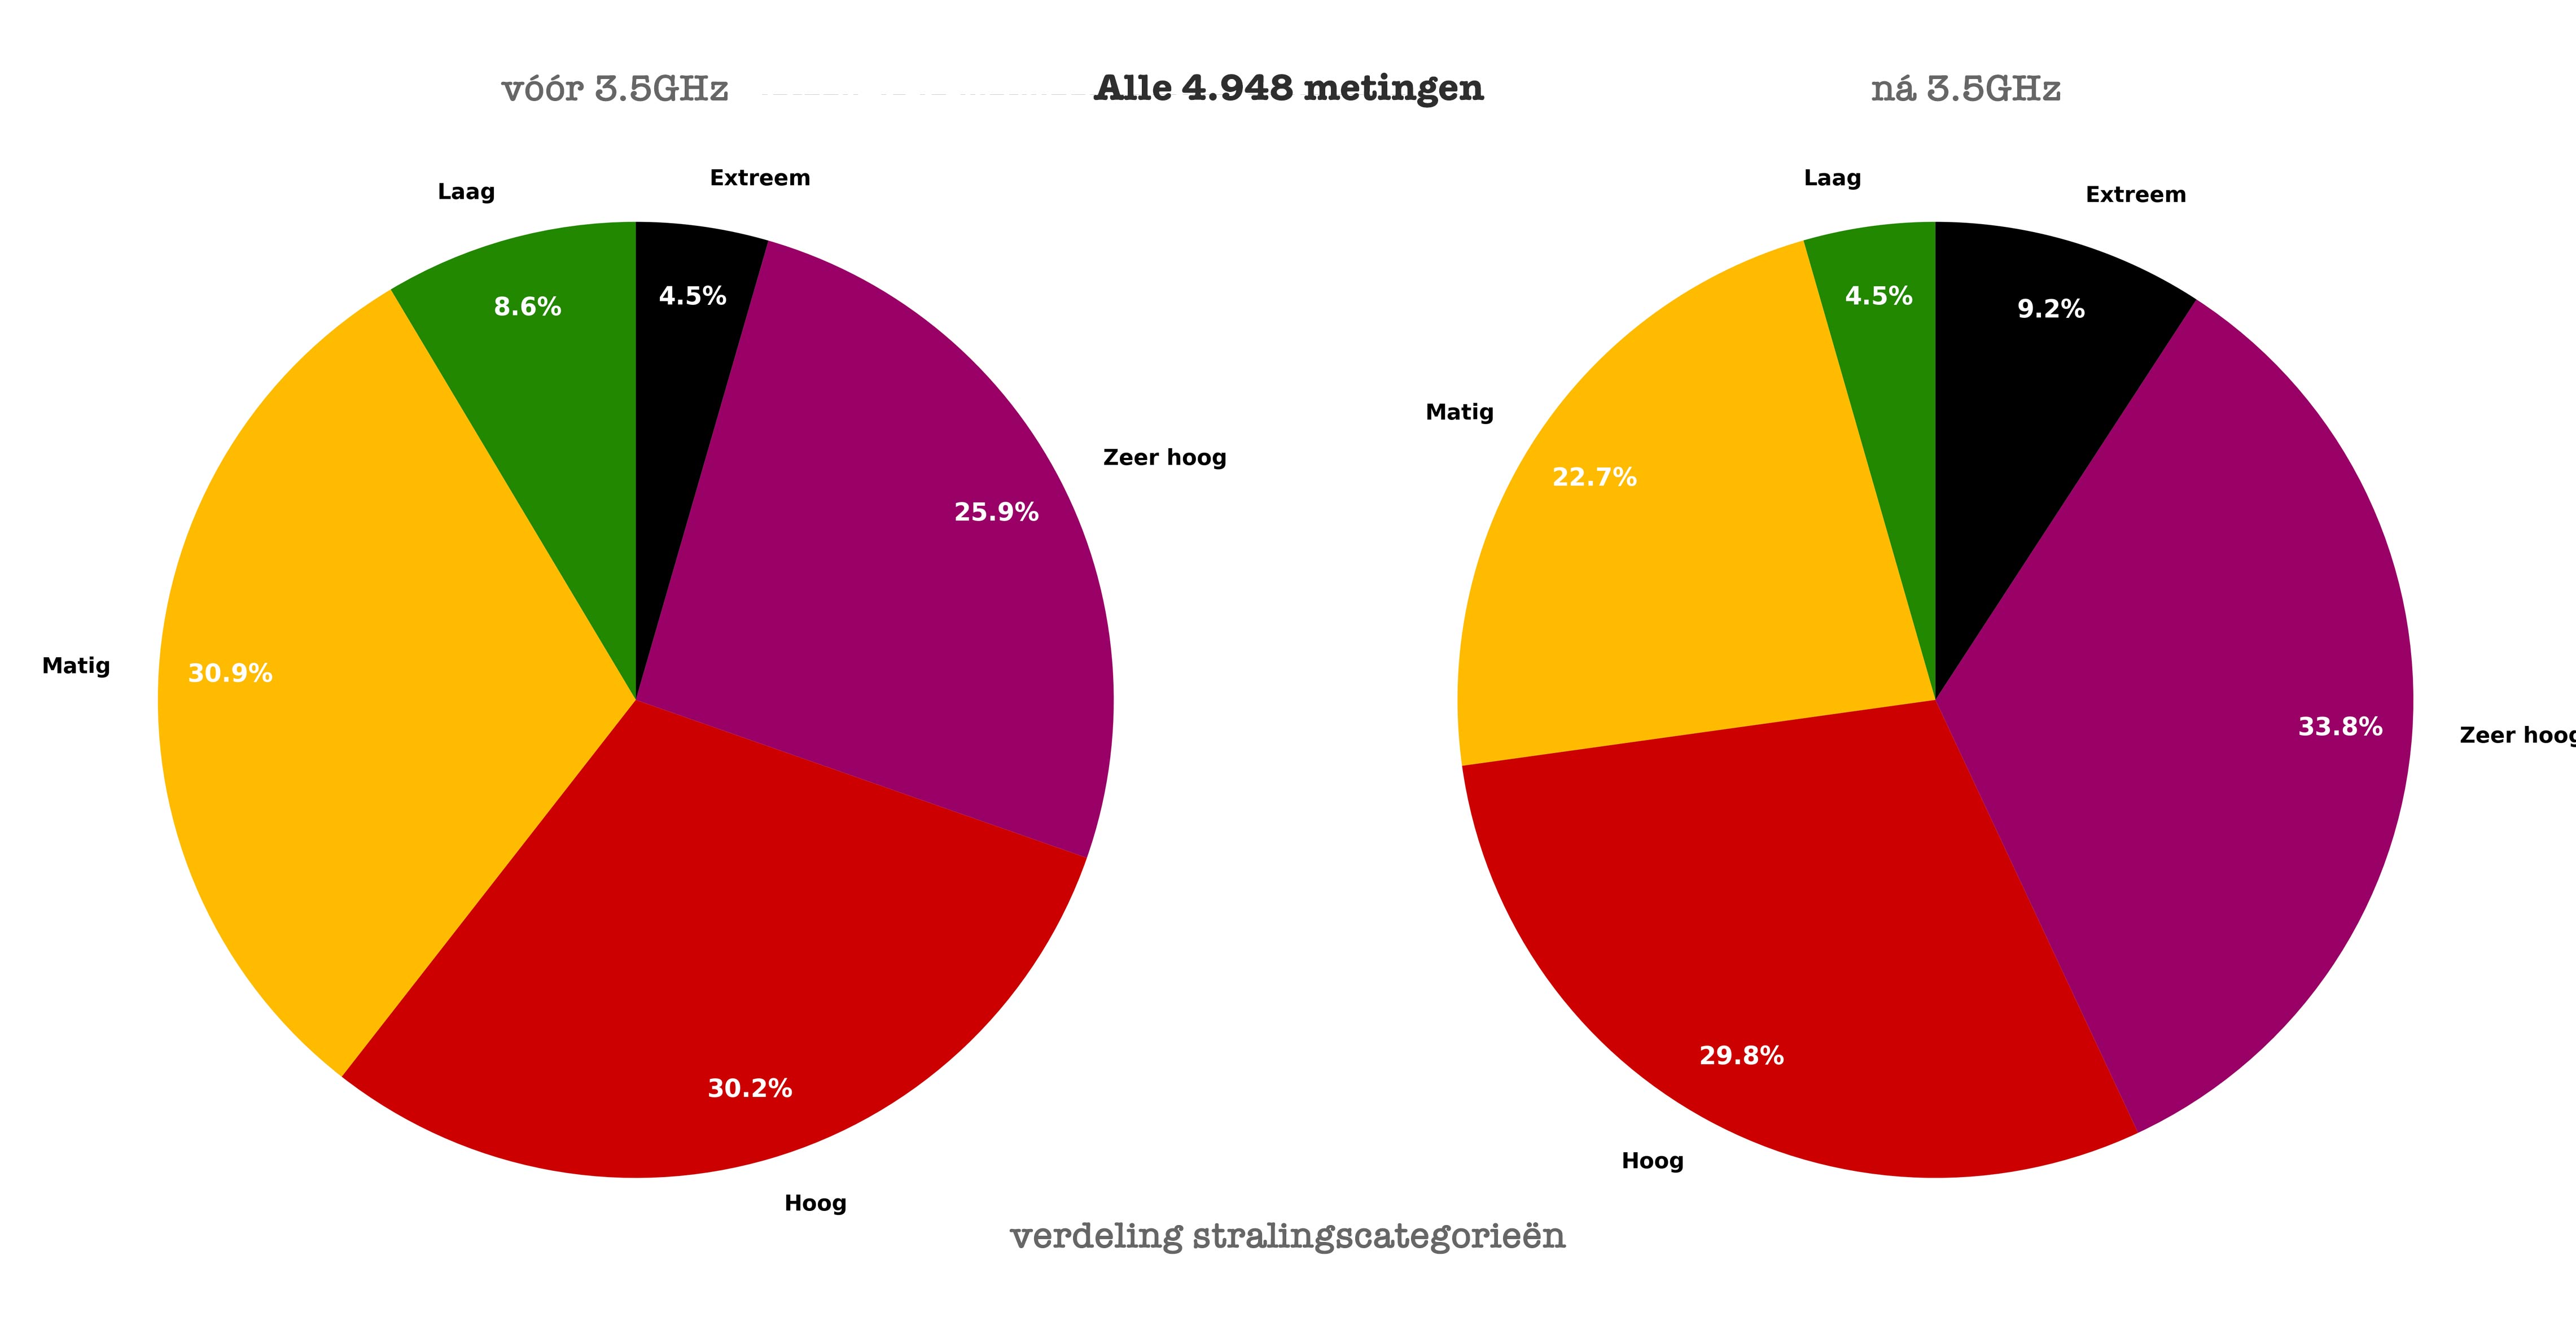
Both analyses show the same trend
A shift has occurred towards higher radiation values. The low radiation categories (green and yellow) are decreasing, while the higher categories (purple and black) are increasing. In the repeat measurements, radiation increases by a factor of 2.8, while for all measurements that increase is 1.8x. For all measurements, the median increases by 160%, from 2,240 to 5,820 µW/m².
⚠️ Caveats
- Measurements from 2022: Analyses cover a larger period from 12 May 2022 to 21 Sep 2025.
- Geographic variation: Large cities and areas with high radiation are not equally represented each year.
- Sample variation: Repeat measurements are limited to 92 locations measured both before and after.
- Seasonal influences: Measurement conditions can vary due to e.g. time of day, weather and vegetation.
- Technical developments: In addition to 3.5GHz, technical upgrades to the network also contribute to the increase.
- Volunteer network: Measurements were performed by volunteers without a professional background.
Conclusion
For this impact analysis, calibrated equipment and a fixed methodology were used. This makes the figures highly reliable. The consistent quality of the meter and the reproducible setup means that results are well comparable with each other.
The average peak value has doubled, from 20,000 to 42,000 µW/m², which represents an extreme change to our living environment. The decrease in low-radiation areas and the increase in the extreme category calls for immediate action.
We call on those responsible at municipalities, provinces and the national government to take their responsibility by monitoring EMF radiation seriously and extensively, and to limit the possible environmental damage caused by EMF.
Analyses based on measurements up to 21 September 2025. Excluding measurements near defense radar.