All Measurement Data Analysis
All measurements before and after 3.5GHz
EMF Map NL has conducted two extensive analyses to map the effects of the introduction of the 3.5GHz frequency. In this second study, all measurements performed were compared with each other, those before and after the introduction. This study shows: EMF radiation has increased by a factor of 1.8 since the introduction of 3.5GHz, summer 2024.
🔬 Methodology & Reliability
- Calibrated equipment: Safe and Sound Pro II radiation meters
- Standardized protocol: Fixed methodology for 1-point and 4-point measurements
- Trained volunteers: Precise reproducible execution
- Transparent data: Full datasets available
- Clean comparison: Measurements near defense radar excluded
Data Points
- 4,948 measurements at 4,742 locations
- 2,882 before and 2,066 after 3.5GHz
- Of which 4-point measurements: 4,126
- 191 cities and 55 municipalities
- Between May 2022 - Sep 2025
Key Figures
- Increase by a factor of 1.8x
- Average increase of 82%
- 31% decrease in low and moderate radiation
- Extreme category increase +104%
- Median increase 160%
🔍 All Measurements on Timeline
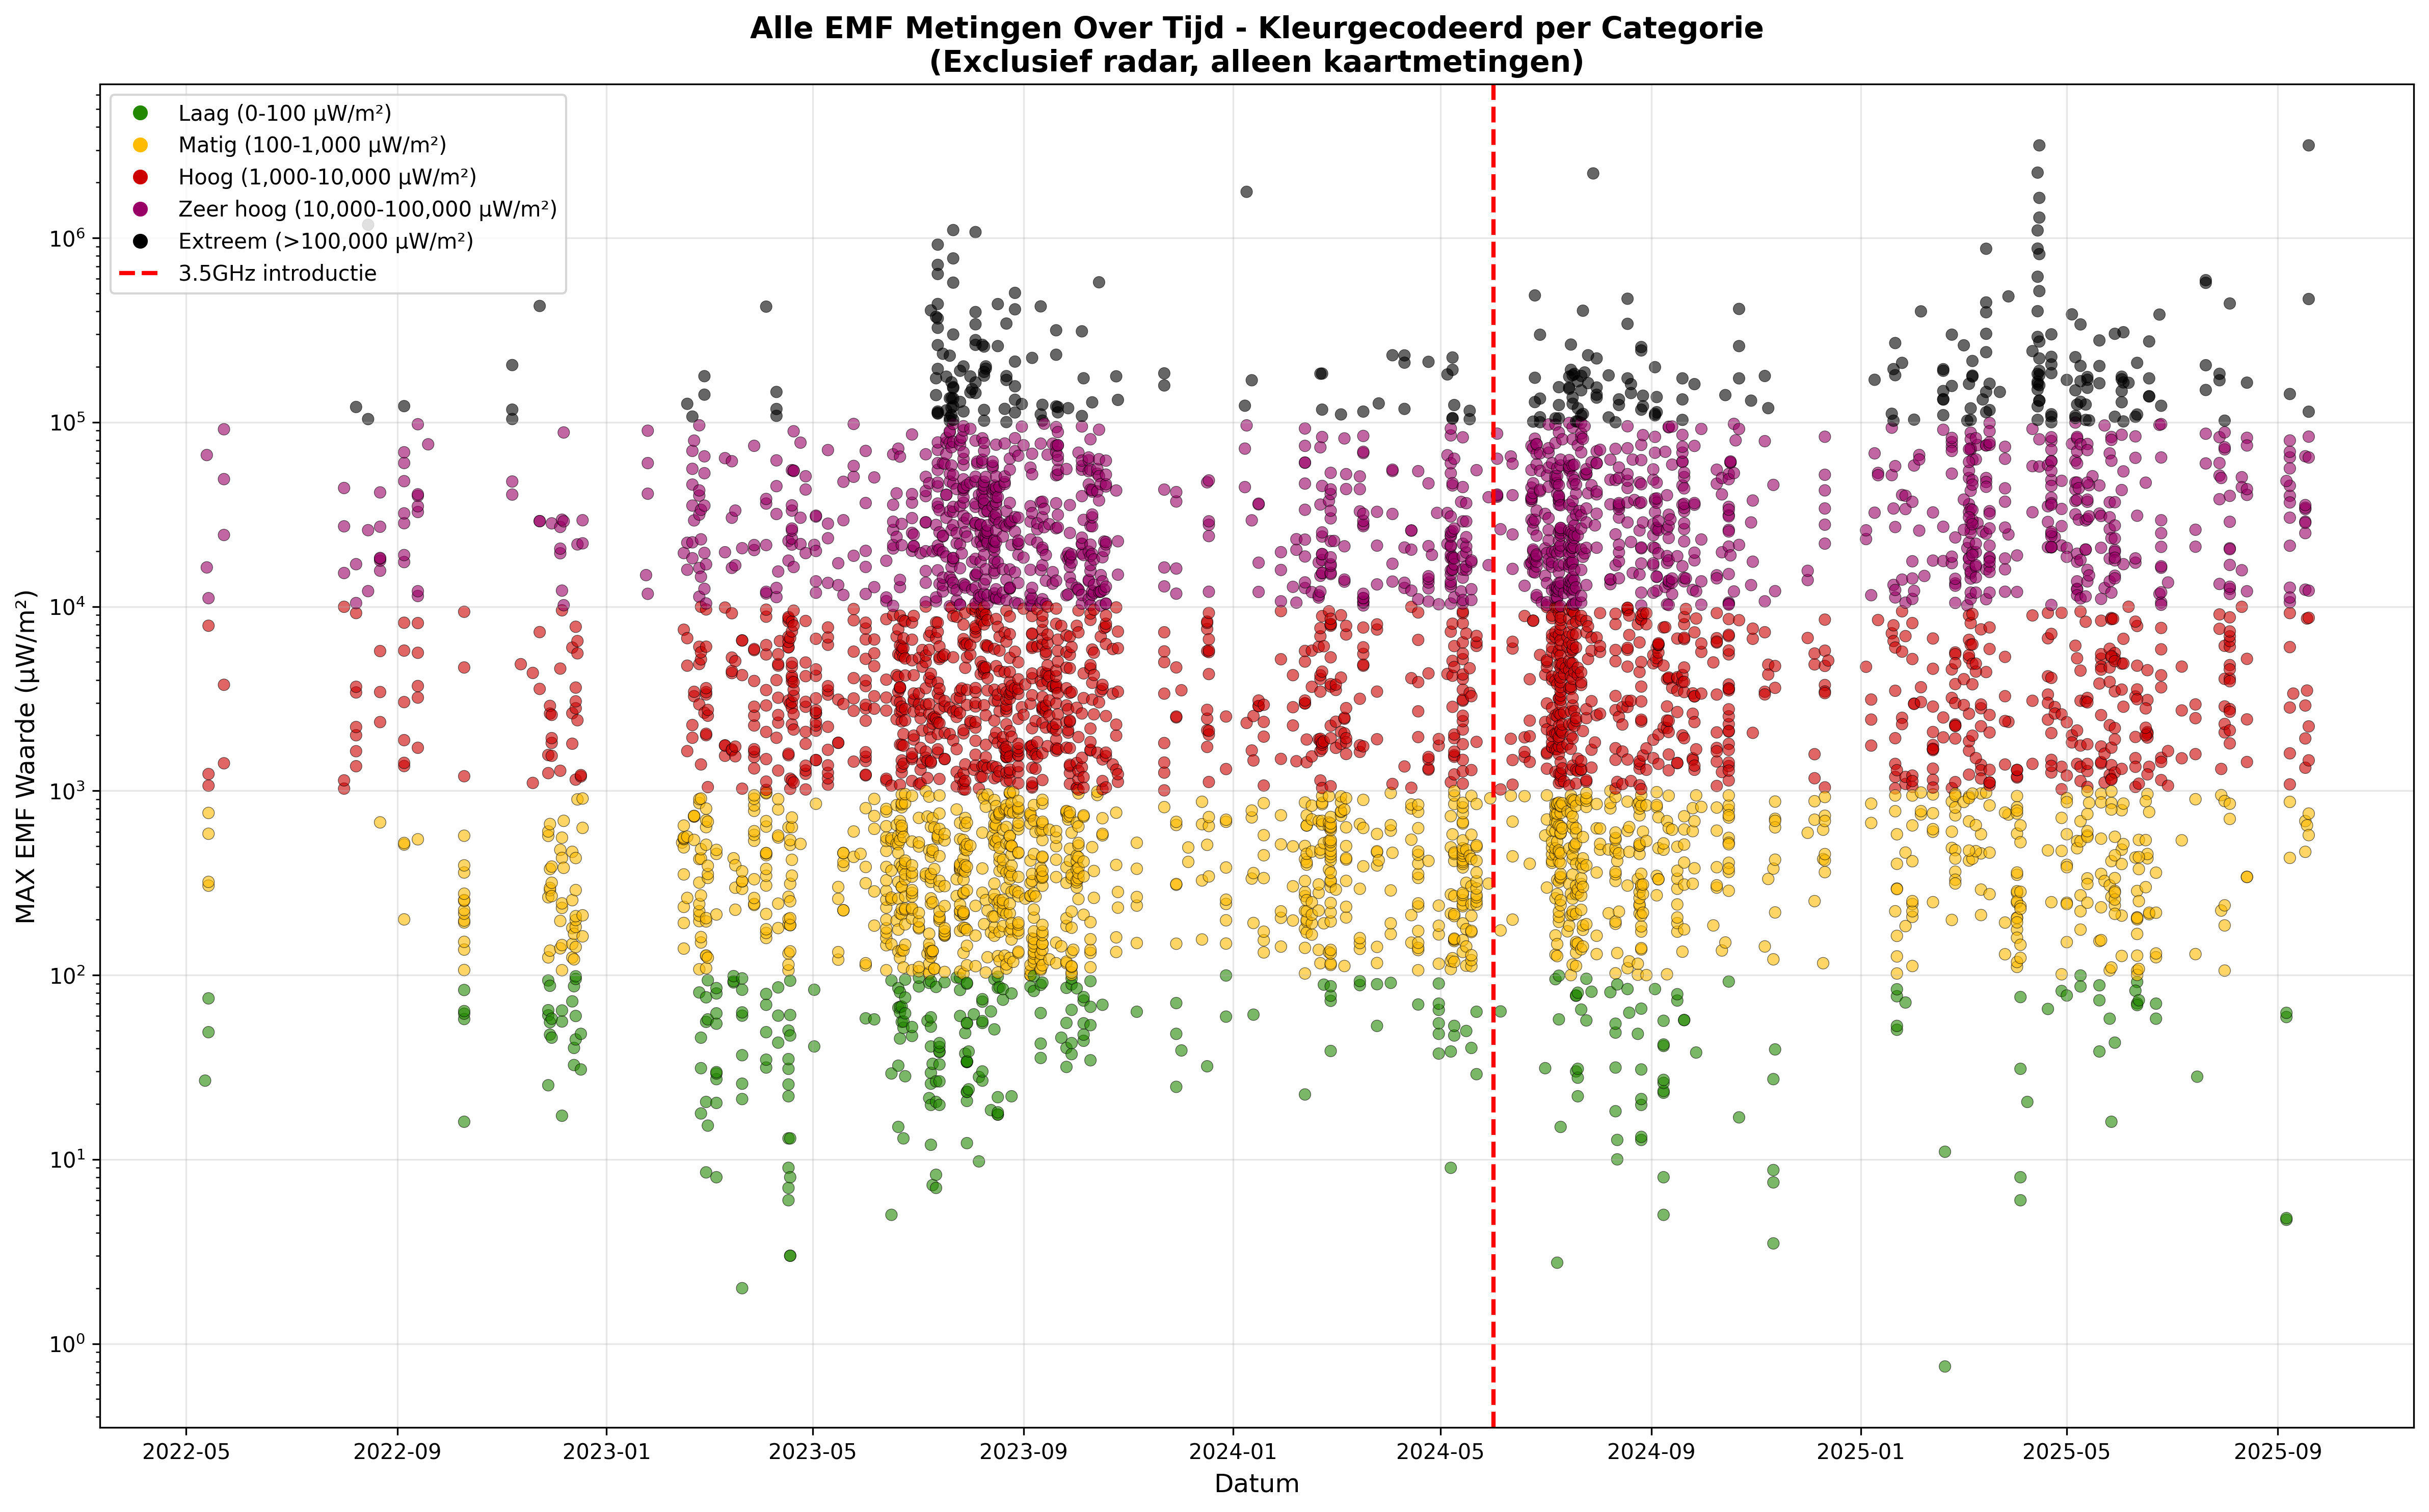
Clear increase in high radiation values (red, purple, black) after the 3.5GHz introduction, summer 2024
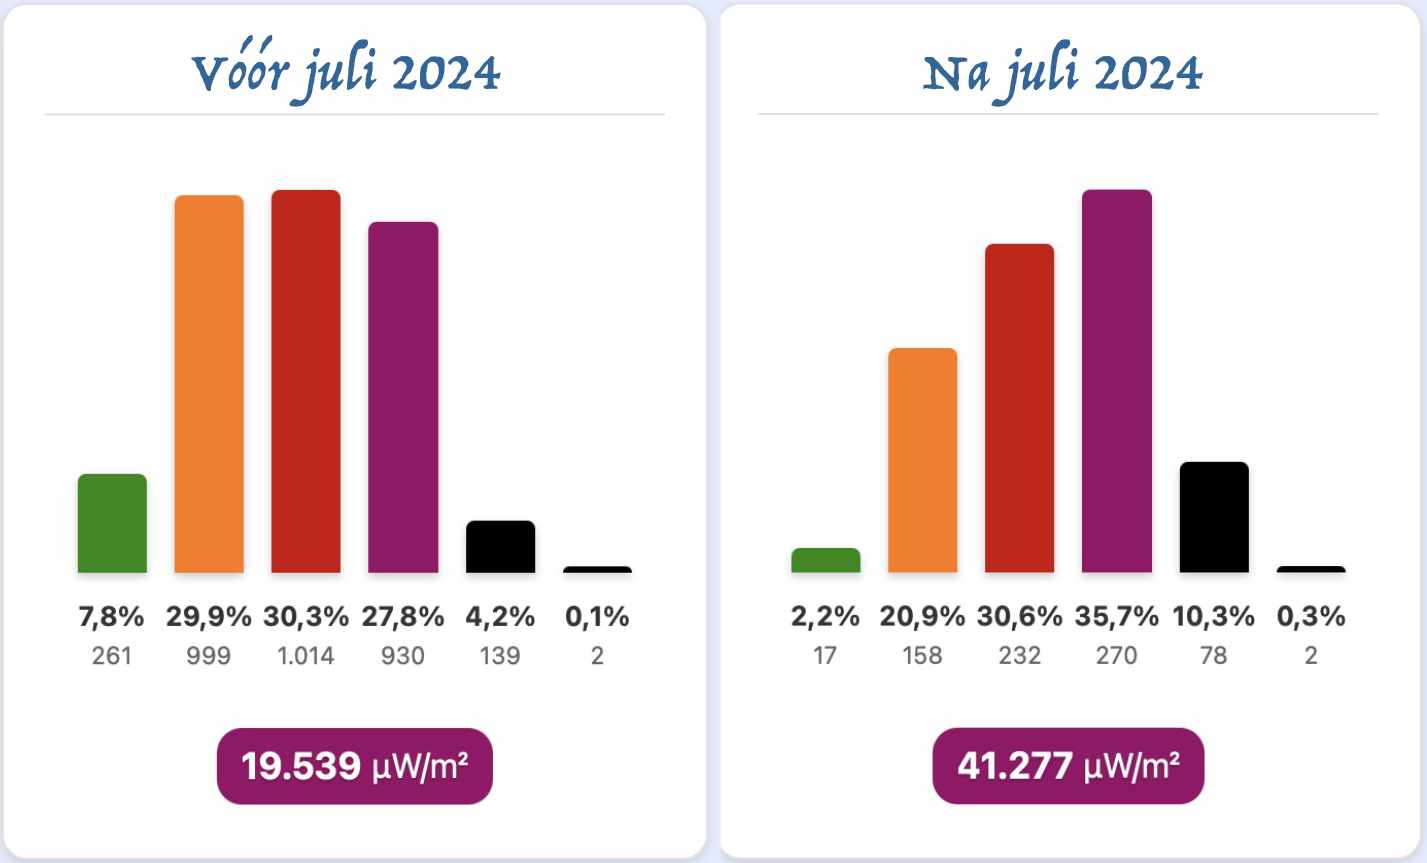
Before the introduction (up to June 2024)
- 2,882 measurements
- Average: 20,706 µW/m²
- Median: 2,240 µW/m²
- Maximum value: 1,780,000 µW/m²
- Extreme category: 4.5%
After the introduction (from June 2024)
- 2,066 measurements
- Average: 37,301 µW/m² (+80%)
- Median: 5,820 µW/m² (+160%)
- Maximum value: 3,180,000 µW/m²
- Extreme category: 9.2% (+104%)
📈 Doubling of average peak value
All 4-point measurements compared, before and after 21 September 2024. Doubling of the average peak value, from 20,000 to 42,000 µW/m².
📊 All Measurements before and after 3.5GHz
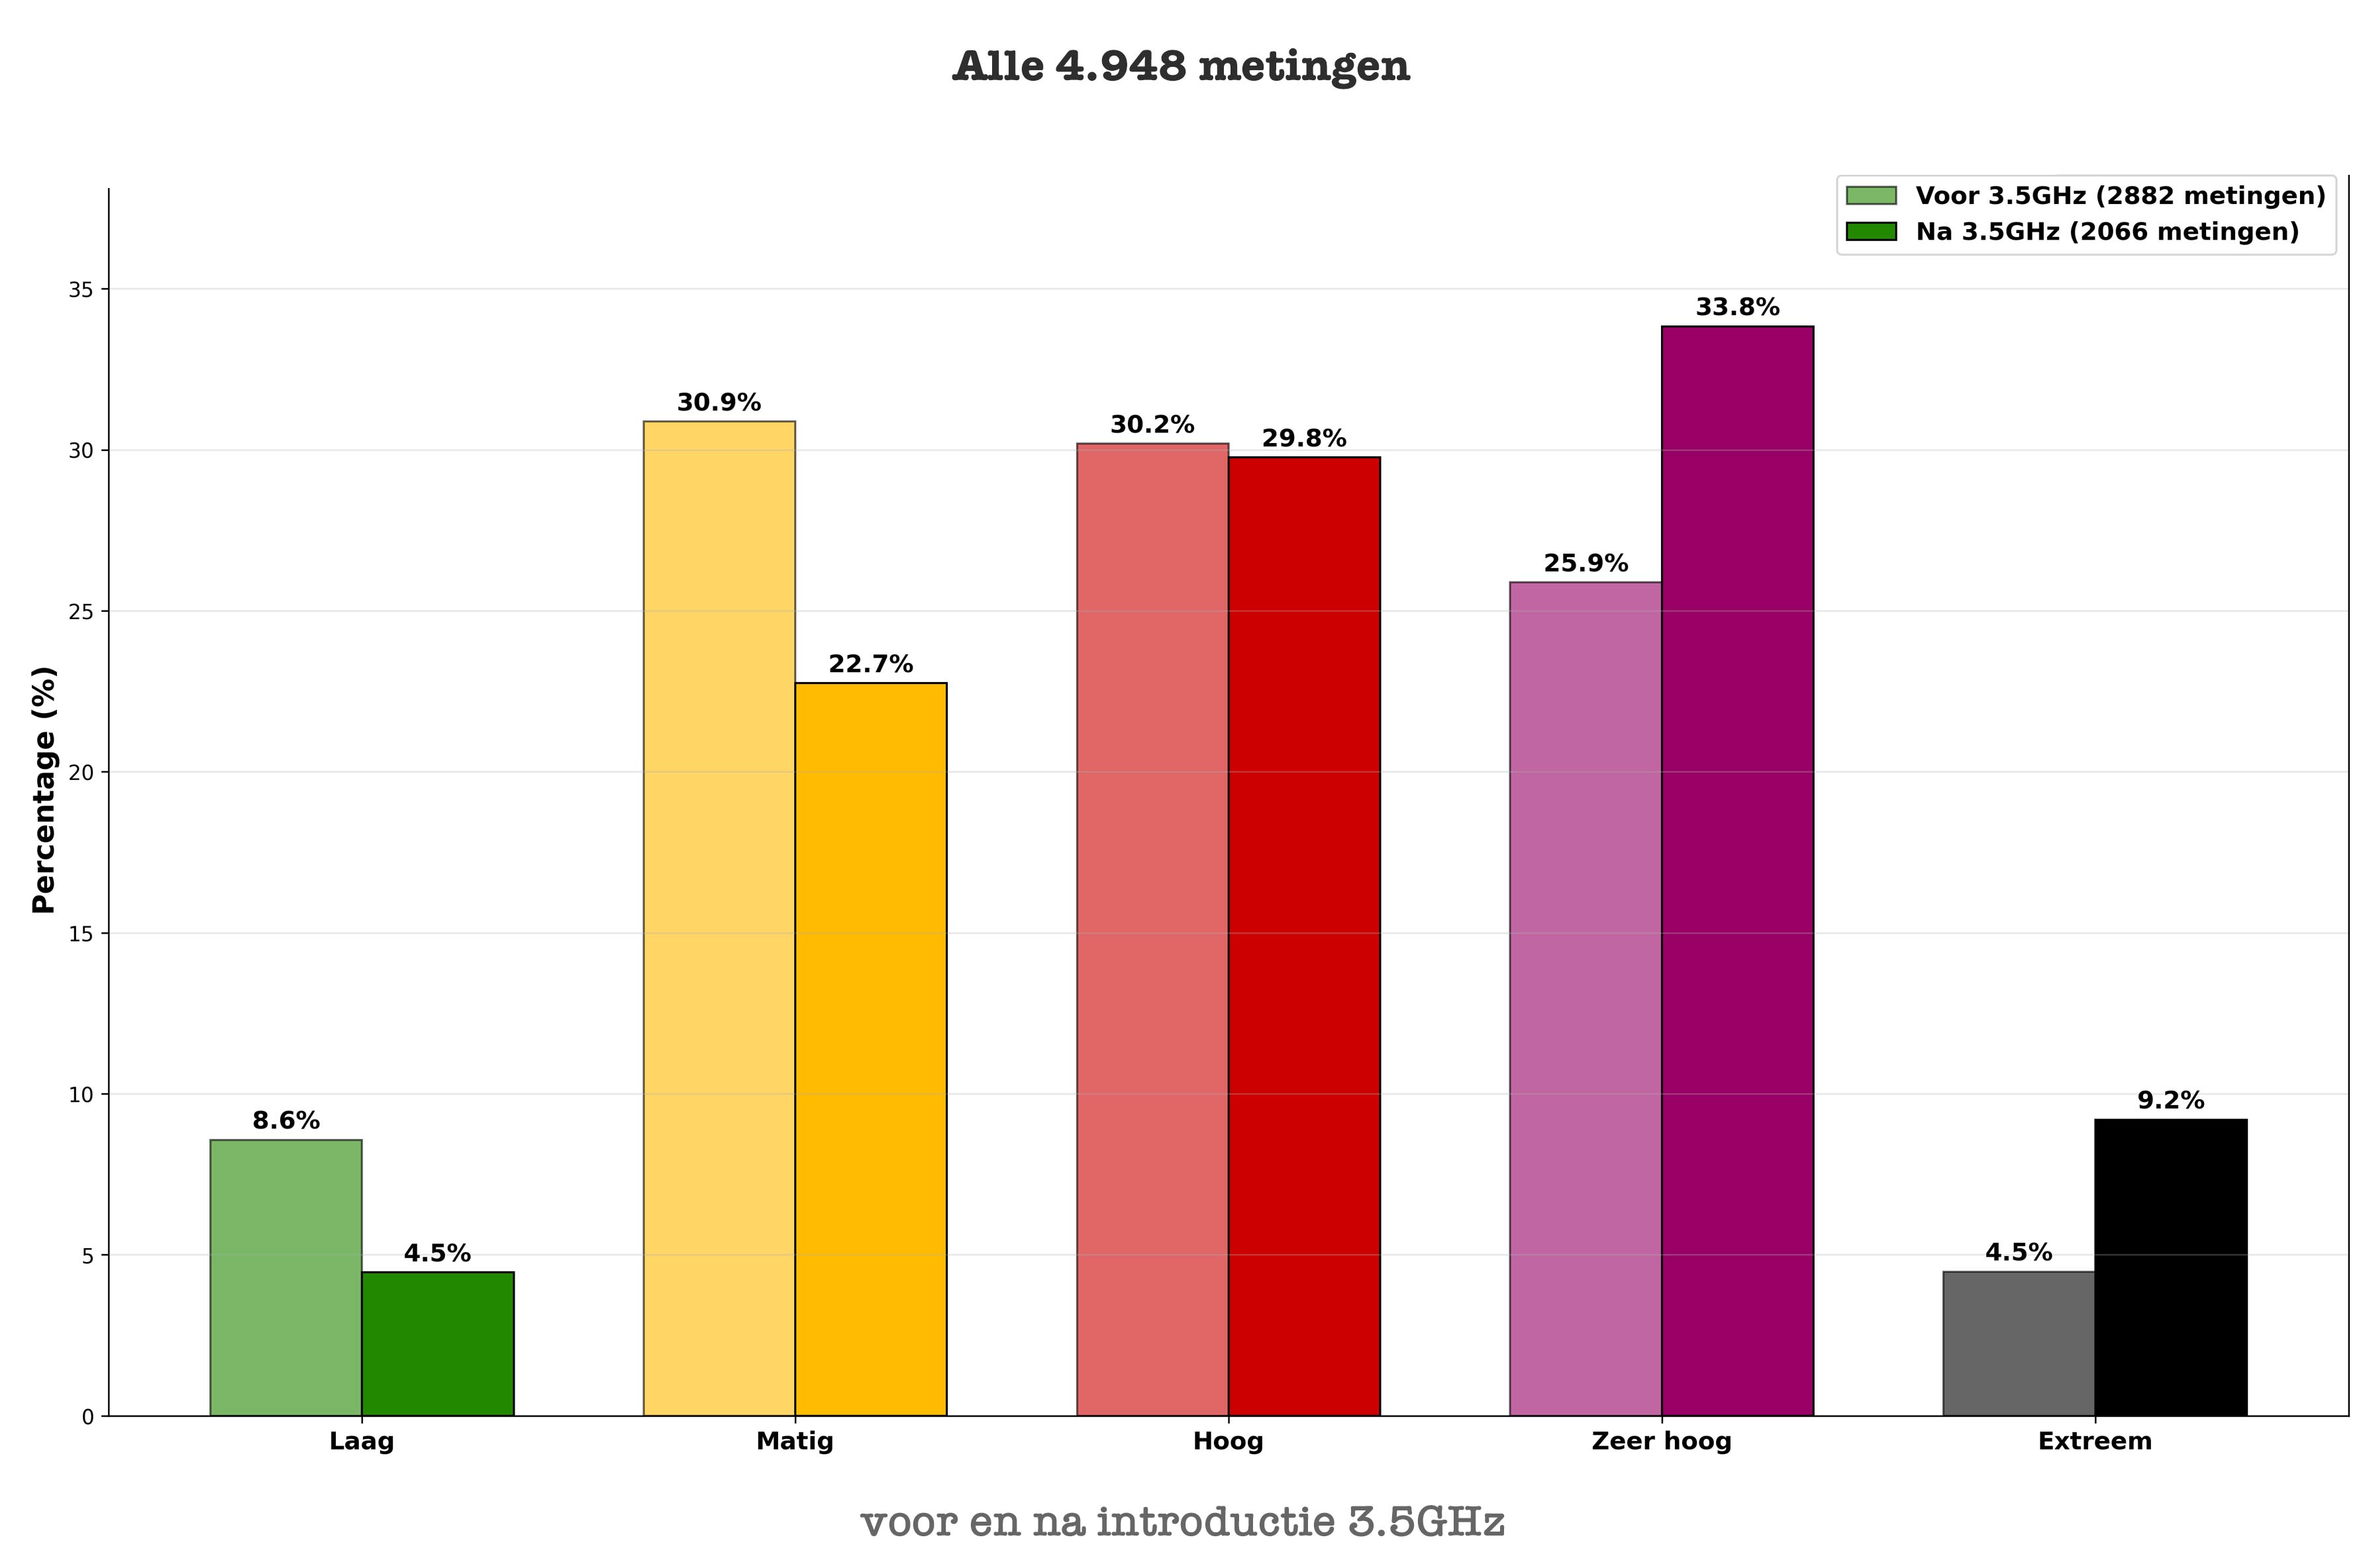
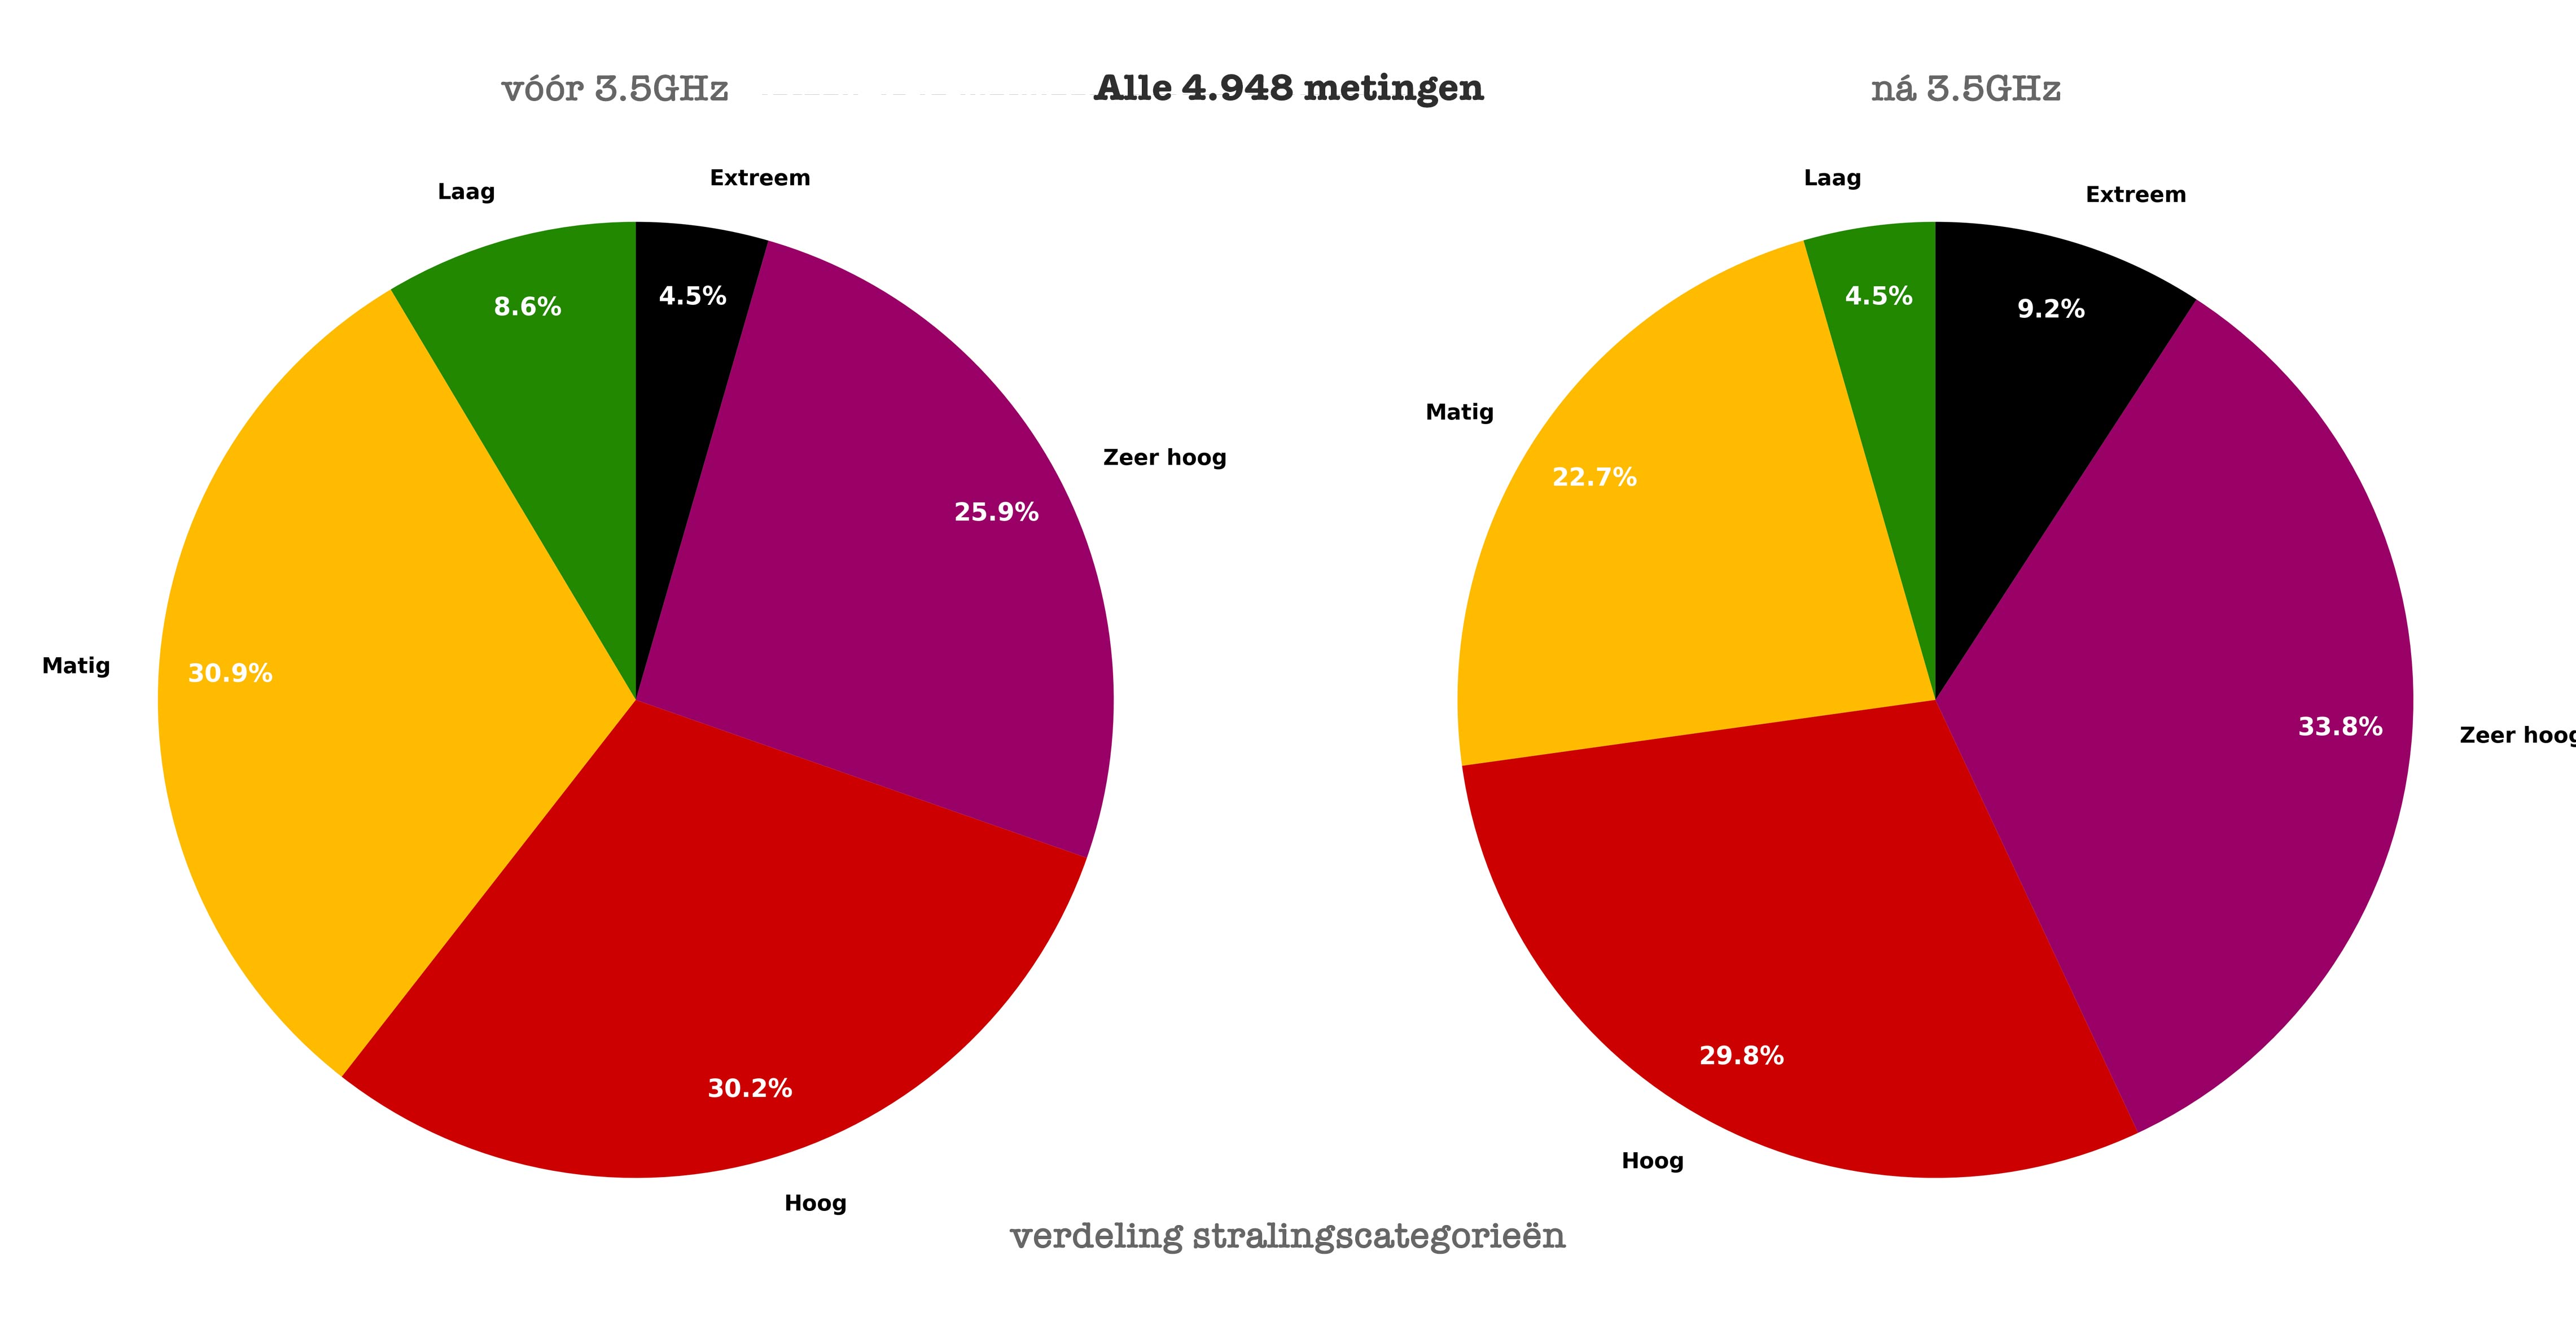
All measurements compared, before and after 1 June 2024. Notable is the doubling of the 'Extreme' category from 4.5% to 9.2%.
National effect
The EMF increase after the 3.5GHz introduction is not limited to specific regions, but is observable throughout the Netherlands.
Conclusion All Measurements
Since the introduction of 3.5GHz, radiation values have increased by a factor of 1.8. The median value has increased by 160%, indicating a structural shift in the EMF landscape of the Netherlands.
🔄 Repeat Measurements Analysis
Detailed comparison of 92 locations measured both before and after the introduction.
🗺️ Repeat Measurement Locations
Detailed comparison of 92 locations measured both before and after the introduction.
Analyses based on measurements up to 21 September 2025. Excluding measurements near defense radar.